Level:
Correct: 0
Incorrect: 0
Marks: 0/0
Exam Practice
Course:
Topics:
AQA A-Level Biology (Paper 3) Smart practice A mixed round aimed at your weak spots
Unit 1
Required practical activities
Unit 2
Practical and mathematical skills
Unit 3
Critical analysis of experimental data
Unit 4
The essay
Avg
score:
–
Topics
done:
0/26

Data analysis: energy transfer and ecosystems

Practise 14 exam-style questions on Data analysis: energy transfer and ecosystems for AQA A-Level Biology (Paper 3). Write your answer as you would in the exam and get it marked in seconds against the mark scheme, point by point, with the Study Helper on hand if you get stuck.

  • 14 questions
  • 5–9 marks each
  • Instant marking
  • No sign-up needed
14 questions, marked as you go

Sample questions with model answers

Here are 4 of the questions in this topic, each with a model answer, an explanation of why it earns the marks and the mark scheme an examiner would use.

Question 1

6 marks

An invasive non-native plant grows up to 2 m tall along riverbanks. It forms dense stands in summer and dies back in winter. Ecologists investigated its effect on native plants. Along one river, they marked out 20 square areas, each 2 m × 2 m, in dense stands of the invasive plant. In 10 of these areas, chosen at random, they pulled up every invasive plant each spring for 2 years; in the other 10 areas they did nothing. After 2 years, they recorded the number of native plant species in each area. In midsummer, the light intensity at ground level was 55% of full daylight in the areas where the invasive plant had been removed and 12% in the other areas.

The graph shows the mean number of native plant species per area. The error bars show ± 2 standard deviations, which includes over 95% of the data.

Use the error bars to explain what you can conclude about the difference between the two treatments.

Use the information to explain how the invasive plant affects native plants.

Explain why the areas from which the invasive plant was removed were chosen at random.

The ecologists concluded that pulling up the invasive plant is the best way to conserve native plants along rivers. Give one reason why the data do not support this conclusion.
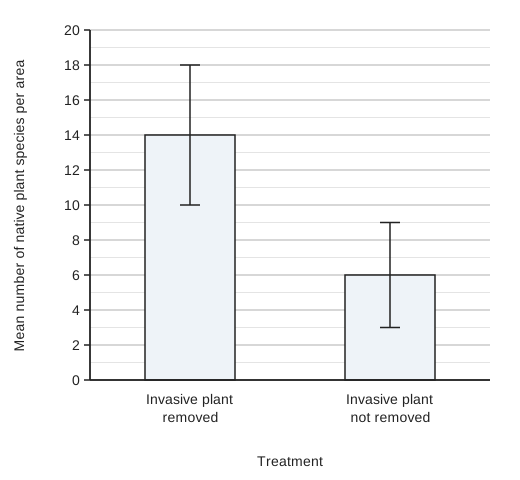
Bar chart with two bars and error bars. Vertical axis: mean number of native plant species per area, 0 to 20, with gridlines every 1 species. Bar 1, invasive plant removed: mean 14, error bar from 10 to 18. Bar 2, invasive plant not removed: mean 6, error bar from 3 to 9.

Model answer

The error bars do not overlap (10 to 18 species compared with 3 to 9), so the difference between the means is probably not due to chance: removing the invasive plant significantly increased the number of native species.

The invasive plant competes with native plants (interspecific competition). It is tall and forms dense stands, so it shades the native plants: light at ground level was only 12% of daylight, compared with 55% where it was removed. The native plants therefore photosynthesise less and cannot make enough sugars to grow and reproduce, so fewer species survive. It may also compete with them for water and mineral ions.

Choosing the areas at random avoids bias, so that other variables such as soil type or flooding are spread between the two treatments and do not cause the difference.

The data do not support the conclusion because no other method of control, such as cutting or using herbicide, was compared.

Explanation

Non-overlapping ± 2 SD bars suggest a real (significant) difference between means; overlapping bars suggest the difference may be due to chance. Invasive species often reduce biodiversity by out-competing native species for light, and the light measurements here support that explanation. Random allocation of treatments is how an investigation avoids bias from uncontrolled variables in the field. A claim that one method is "best" needs a comparison with other methods.

Mark scheme
  1. 1 mark

    The error bars / ± 2 SD ranges (10 to 18 and 3 to 9) do not overlap

    Max 6. Points 1 and 2.

  2. 1 mark

    So the difference in the mean number of native species is probably not due to chance / is significant

    Reject 'the results are not due to chance' and 'the results are significant' (it is the difference that may or may not be due to chance).

  3. 1 mark

    (Interspecific) competition between the invasive plant and native plants

    Points 3 to 5: max 2. Reject intraspecific competition.

  4. 1 mark

    For light: the tall invasive plant shades the native plants (12% compared with 55% of daylight), so they photosynthesise less / make too little sugar to grow and reproduce

  5. 1 mark

    For water / mineral ions / space, so fewer native species can survive in the areas

  6. 1 mark

    To avoid bias: so that differences in other variables (e.g. soil, flooding, shade from trees) are spread between the two treatments / each area has an equal chance of being in either treatment

    Point 6. Insufficient: 'to make it fair' or 'to make it reliable' with no explanation.

  7. 1 mark

    No other methods of control (e.g. cutting, grazing or herbicide) were compared

    Points 7 to 9: max 1. List rule: if more than one reason is given, a wrong or contradictory extra answer cancels the correct one.

  8. 1 mark

    Only one river / one stretch of river was studied, so the results may not apply to other rivers

  9. 1 mark

    Only 2 years: the long-term effect (e.g. regrowth from seeds in the soil) is not known
Question 2

7 marks

Sunflower seeds store mainly lipid. Scientists germinated sunflower seeds in the dark for 5 days and then in the light. Each day, they measured the volume of oxygen taken in and the volume of carbon dioxide released by a sample of 50 seedlings over 1 hour in the dark. They used these values to calculate the respiratory quotient (RQ):

RQ = volume of carbon dioxide released ÷ volume of oxygen taken in

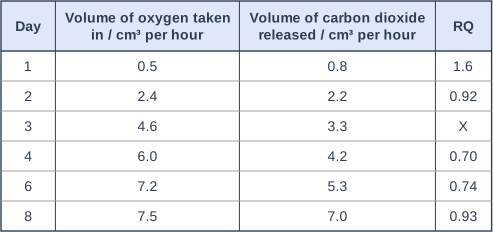
The RQ is 1.0 when carbohydrate is respired and about 0.7 when lipid is respired. The table shows their results.

Calculate the value of X. Give your answer to 2 significant figures.

Suggest why the measurements were made in the dark, even after day 5.

Explain why the RQ on day 1 was greater than 1.0.

A student concluded that, by day 8, the seedlings were respiring only carbohydrate that they had made by photosynthesis. Evaluate this conclusion.

Table with columns "Day", "Volume of oxygen taken in / cm³ per hour", "Volume of carbon dioxide released / cm³ per hour", "RQ". Day: 1; Volume of oxygen taken in / cm³ per hour: 0.5; Volume of carbon dioxide released / cm³ per hour: 0.8; RQ: 1.6 | Day: 2; Volume of oxygen taken in / cm³ per hour: 2.4; Volume of carbon dioxide released / cm³ per hour: 2.2; RQ: 0.92 | Day: 3; Volume of oxygen taken in / cm³ per hour: 4.6; Volume of carbon dioxide released / cm³ per hour: 3.3; RQ: X | Day: 4; Volume of oxygen taken in / cm³ per hour: 6.0; Volume of carbon dioxide released / cm³ per hour: 4.2; RQ: 0.70 | Day: 6; Volume of oxygen taken in / cm³ per hour: 7.2; Volume of carbon dioxide released / cm³ per hour: 5.3; RQ: 0.74 | Day: 8; Volume of oxygen taken in / cm³ per hour: 7.5; Volume of carbon dioxide released / cm³ per hour: 7.0; RQ: 0.93.

Model answer

X = 3.3 ÷ 4.6 = 0.717 = 0.72 (2 s.f.)

In the light, the seedlings would photosynthesise, taking in carbon dioxide and releasing oxygen, so the measured volumes would not show respiration alone.

On day 1, little oxygen can enter the seed before the seed coat splits, so some of the respiration is anaerobic. Converting pyruvate to ethanol releases carbon dioxide without any oxygen being taken in, so the RQ is greater than 1.0.

The RQ rose from 0.74 on day 6 to 0.93 on day 8, towards the value for carbohydrate, after the seedlings were moved into the light, where they can photosynthesise and make sugars. However, 0.93 is still below 1.0, so some lipid was still being respired, not only carbohydrate. No seedlings were kept in the dark after day 5, so the rise could be caused by the lipid store running out rather than by photosynthesis, and only two measurements were made after day 5.

Explanation

The RQ shows which substrate is being respired: about 1.0 for carbohydrate and about 0.7 for lipid, because lipids need more oxygen to oxidise all their hydrogen. An RQ above 1.0 means carbon dioxide is being released without oxygen uptake, as in anaerobic respiration producing ethanol. Gas exchange must be measured in the dark in green tissue, otherwise photosynthesis interferes. An RQ between 0.7 and 1.0 shows a mixture of substrates, and a change can be linked to light only if seedlings kept in the dark are measured as well.

Mark scheme
  1. 1 mark

    0.72 (3.3 ÷ 4.6); a correct answer of 0.72 with no working scores this mark

    Max 7. Point 1: a correct answer of 0.72 with no working scores the mark. Do not accept 0.717 (not 2 significant figures) or 1.4 (4.6 ÷ 3.3, inverted).

  2. 1 mark

    In the light, photosynthesis would take in carbon dioxide and release oxygen, so the gas volumes would not measure respiration alone

    Point 2.

  3. 1 mark

    On day 1, (some) anaerobic respiration takes place (little oxygen can enter the seed before the seed coat splits)

    Points 3 and 4. Reject 'lactate is produced'.

  4. 1 mark

    Anaerobic respiration releases carbon dioxide (when pyruvate is converted to ethanol) without taking in oxygen, so more carbon dioxide is released than oxygen taken in

  5. 1 mark

    Supports: the RQ rose from 0.74 on day 6 to 0.93 on day 8, towards the value for carbohydrate (1.0), only after the seedlings were moved into the light

    Points 5 to 10: max 3; an answer that gives only points supporting the conclusion, or only points against it, scores at most 2 of these marks.

  6. 1 mark

    Supports: in the light the seedlings can photosynthesise and make sugars (carbohydrate) that can be respired

  7. 1 mark

    Against: the RQ on day 8 (0.93) is still below 1.0, so some lipid was still being respired, not only carbohydrate

  8. 1 mark

    Against: the carbohydrate could have come from the seed's own store / the lipid store may simply have been running out, rather than the change being caused by photosynthesis

  9. 1 mark

    Against: there were no seedlings kept in the dark after day 5 (no control), so the rise in RQ cannot be linked to the light / to photosynthesis

  10. 1 mark

    Against: only two measurements were made after the seedlings were moved into the light / one sample of 50 seedlings each day, with no repeats

Question 3

8 marks

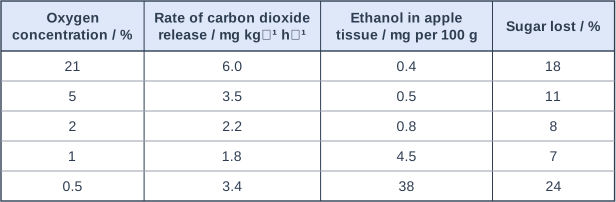
After harvest, apples continue to respire, which uses up their sugars. Scientists stored apples at 3 °C for 4 months in five atmospheres containing different concentrations of oxygen. They then measured the rate at which the apples released carbon dioxide, the concentration of ethanol in the apple tissue and the percentage of the apples' sugar that had been lost. The table shows their results.

Calculate the percentage decrease in the rate of carbon dioxide release when the oxygen concentration was reduced from 21% to 2%. Give your answer to 3 significant figures.

Explain the results for the apples stored in 0.5% oxygen.

Ethanol gives apples an unpleasant flavour. A storage company concluded that apples should be stored in 1% oxygen, because this gave the smallest loss of sugar. Use the data to evaluate this conclusion.

Table with columns "Oxygen concentration / %", "Rate of carbon dioxide release / mg kg⁻¹ h⁻¹", "Ethanol in apple tissue / mg per 100 g", "Sugar lost / %". Oxygen concentration / %: 21; Rate of carbon dioxide release / mg kg⁻¹ h⁻¹: 6.0; Ethanol in apple tissue / mg per 100 g: 0.4; Sugar lost / %: 18 | Oxygen concentration / %: 5; Rate of carbon dioxide release / mg kg⁻¹ h⁻¹: 3.5; Ethanol in apple tissue / mg per 100 g: 0.5; Sugar lost / %: 11 | Oxygen concentration / %: 2; Rate of carbon dioxide release / mg kg⁻¹ h⁻¹: 2.2; Ethanol in apple tissue / mg per 100 g: 0.8; Sugar lost / %: 8 | Oxygen concentration / %: 1; Rate of carbon dioxide release / mg kg⁻¹ h⁻¹: 1.8; Ethanol in apple tissue / mg per 100 g: 4.5; Sugar lost / %: 7 | Oxygen concentration / %: 0.5; Rate of carbon dioxide release / mg kg⁻¹ h⁻¹: 3.4; Ethanol in apple tissue / mg per 100 g: 38; Sugar lost / %: 24.

Model answer

Percentage decrease = (6.0 - 2.2) ÷ 6.0 × 100 = 3.8 ÷ 6.0 × 100 = 63.3%

At 0.5% oxygen the apples respire anaerobically. Pyruvate is converted to ethanol and carbon dioxide, which regenerates NAD so that glycolysis can continue; this is why ethanol rose to 38 mg per 100 g. Anaerobic respiration releases only 2 ATP per glucose, so glucose is broken down much faster, which increases the rate of carbon dioxide release (3.4 compared with 1.8) and the loss of sugar (24% compared with 7%, even more than the 18% lost in air).

1% oxygen did give the smallest sugar loss (7%) and the slowest carbon dioxide release (1.8), which supports the conclusion. However, the ethanol concentration at 1% (4.5 mg per 100 g) was about 6 times that at 2%, so the apples may taste unpleasant, while 2% lost almost as little sugar (8%) with very little ethanol. 1% is also close to the concentration at which anaerobic respiration takes over, so a small fall in oxygen could spoil the apples. Only one variety, one temperature and one storage time were tested, with no repeats, so the difference between 7% and 8% may not be significant.

Explanation

Lowering oxygen slows aerobic respiration because oxygen is the final electron acceptor. Below a critical oxygen concentration, anaerobic respiration takes over: in plants it produces ethanol and carbon dioxide, and because it yields so little ATP, more sugar is used, so carbon dioxide release rises again. A common error is to say plant cells produce lactate. The condition with the smallest sugar loss is not necessarily the best if it produces more ethanol and is close to the point where fermentation takes over: weigh every column of the table.

Mark scheme
  1. 1 mark

    Correct method: (6.0 - 2.2) ÷ 6.0 × 100; or a correct final answer of 63.3 (%) with no working

    Max 8. Points 1 and 2: a correct answer of 63.3% with no working scores 2 marks. Accept for 1 mark: 36.7 (2.2 ÷ 6.0 × 100), OR 0.633 (not multiplied by 100), OR 173 (difference divided by 2.2), OR 63 / 63.33 (not given to 3 significant figures).

  2. 1 mark

    63.3 (%)

  3. 1 mark

    Anaerobic respiration (alcoholic fermentation) takes place

    Points 3 to 6: max 2. Reject 'lactate is produced'.

  4. 1 mark

    Pyruvate is converted to ethanol and carbon dioxide (using reduced NAD), so ethanol accumulates (38 mg per 100 g)

  5. 1 mark

    This regenerates (oxidised) NAD, so glycolysis can continue

  6. 1 mark

    Anaerobic respiration releases far less ATP per glucose (2 compared with about 32), so glucose / sugar is broken down faster, releasing more carbon dioxide (3.4 compared with 1.8) and losing more sugar (24% compared with 7%, more than in air)

    Accept 'more glucose must be respired to release the same amount of energy'.

  7. 1 mark

    Supports: 1% oxygen gave the smallest loss of sugar (7%) and the lowest rate of carbon dioxide release (1.8 mg kg⁻¹ h⁻¹), so respiration was slowest

    Points 7 to 12: max 4; an answer that gives only points supporting the conclusion, or only points against it, scores at most 3 of these marks.

  8. 1 mark

    Against: at 1% the ethanol concentration (4.5 mg per 100 g) was about 6 times that at 2% (0.8) / about 11 times that in air (0.4), so the apples may taste unpleasant

  9. 1 mark

    Against: 2% oxygen gave almost the same loss of sugar (8%) with very little ethanol, so 2% may be the better concentration

  10. 1 mark

    Against: 1% is close to the concentration at which anaerobic respiration takes over (at 0.5%, 38 mg ethanol per 100 g and 24% of the sugar lost), so a small fall in the oxygen concentration in a store could spoil the apples

  11. 1 mark

    Against: only one variety / one temperature (3 °C) / one storage time (4 months) was tested, so the result may not apply to other apples or conditions

  12. 1 mark

    Against: no repeats / measure of variation / statistical test, so the difference between 7% and 8% sugar loss may not be significant

    Reject 'the results are due to chance'.

Question 4

8 marks

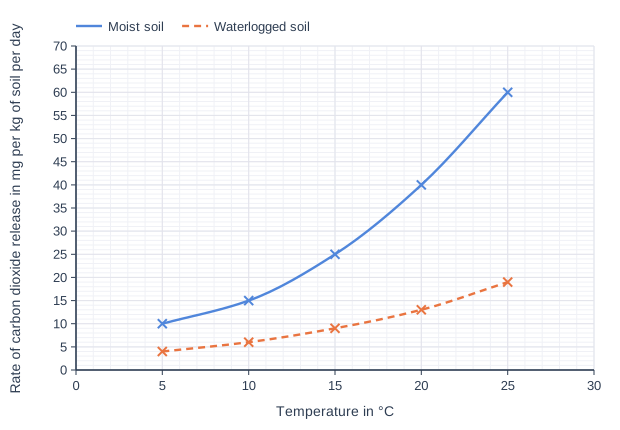
Scientists collected cores of soil from a woodland. They kept samples of the soil in sealed containers at five temperatures, either moist or waterlogged, and measured the rate of carbon dioxide release. The graph shows their results.

The temperature coefficient (Q₁₀) is the rate at (T + 10) °C ÷ the rate at T °C. Calculate the Q₁₀ for moist soil between 10 °C and 20 °C. Give your answer to 2 significant figures.

Explain why the rate of carbon dioxide release from moist soil increased with temperature.

Explain why the rate of carbon dioxide release from waterlogged soil was lower, and increased less as the temperature rose, than from moist soil.

Some scientists suggest that global warming could cause soils to release more carbon dioxide, which would increase global warming further. Use the data to evaluate this suggestion.

Line graph of rate of carbon dioxide release in mg per kg of soil per day (y-axis, 0 to 70) against temperature in °C (x-axis, 0 to 30). "Moist soil" is a smooth curve through (5, 10), (10, 15), (15, 25), (20, 40), (25, 60). "Waterlogged soil" (dashed) is a smooth curve through (5, 4), (10, 6), (15, 9), (20, 13), (25, 19).

Model answer

Q₁₀ = rate at 20 °C ÷ rate at 10 °C = 40 ÷ 15 = 2.67 = 2.7 (2 s.f.)

The carbon dioxide comes from the respiration of saprobionts such as bacteria and fungi. At higher temperatures their enzymes and substrates have more kinetic energy, so more enzyme-substrate complexes form; they digest dead organic matter faster and respire faster, releasing more carbon dioxide.

In waterlogged soil the air spaces are filled with water, so there is less oxygen. The saprobionts carry out less aerobic respiration, so less carbon dioxide is released, and because oxygen is the limiting factor, raising the temperature increases the rate much less.

The data support the suggestion: in moist soil the rate of carbon dioxide release increased from 15 to 40 mg per kg per day between 10 °C and 20 °C, so warming could increase the release of carbon dioxide, causing further warming. However, the soil was kept in sealed containers in a laboratory, and came from one woodland; waterlogged soils released little carbon dioxide even at 25 °C, and warming might also increase plant photosynthesis, which takes in carbon dioxide.

Explanation

Saprobionts digest dead organic matter by secreting enzymes and absorbing the products, then respire them, releasing carbon dioxide. Like all enzyme-controlled processes, this speeds up with temperature (a Q₁₀ of 2 to 3 is typical below the optimum) and needs oxygen for aerobic respiration, so waterlogged soils decompose slowly and store carbon, as in peat. Read values carefully from the line at 10 °C and 20 °C; an evaluation should consider how far laboratory incubations of one soil represent soils in the field.

Mark scheme
  1. 1 mark

    Correct method: 40 ÷ 15 (rates read from the graph at 20 °C and 10 °C); or a correct final answer of 2.7 with no working

    Max 8. Points 1 and 2: a correct answer of 2.7 with no working scores 2 marks. Accept for 1 mark: 2.67 / 2.667 (not given to 2 significant figures), OR 0.38 (15 ÷ 40, inverted), OR correct readings of 15 and 40 with an arithmetic error.

  2. 1 mark

    2.7

  3. 1 mark

    Higher temperature gives molecules more kinetic energy, so more enzyme-substrate complexes form / the respiratory enzymes of the saprobionts (decomposers) work faster

    Points 3 and 4: max 1. Reject 'enzymes are denatured' for this range of temperatures. Insufficient: 'saprobionts / decomposers respire' with no reference to the effect of temperature.

  4. 1 mark

    Saprobionts secrete enzymes that digest dead organic matter faster, providing more respiratory substrate

  5. 1 mark

    Water fills the air spaces in the soil, so there is less oxygen

    Points 5 to 7: max 2.

  6. 1 mark

    So there is less aerobic respiration by saprobionts / microorganisms (and decomposition is slower)

    Accept 'saprobionts respire anaerobically, which is slower / releases less carbon dioxide'.

  7. 1 mark

    Oxygen (not temperature) is the limiting factor, so increasing the temperature has less effect on the rate

    Accept 'the Q₁₀ is lower for waterlogged soil because oxygen limits respiration'.

  8. 1 mark

    Supports: the rate of carbon dioxide release from moist soil increased with temperature (e.g. from 15 to 40 mg per kg per day between 10 °C and 20 °C)

    Points 8 to 12: max 3; an answer that gives only points supporting the suggestion, or only points against it, scores at most 2 of these marks.

  9. 1 mark

    Supports: more carbon dioxide in the atmosphere causes more warming, which would speed up decomposition further (positive feedback)

  10. 1 mark

    Against: the soil was incubated in sealed containers in a laboratory, from one woodland, so the results may not apply to soils in the field

  11. 1 mark

    Against: waterlogged soils release little carbon dioxide even at higher temperatures (about 19 mg per kg per day at 25 °C)

  12. 1 mark

    Against: warming could also increase photosynthesis / plant growth, which takes in more carbon dioxide

Ready to try the rest? Every answer you write is marked against the mark scheme, so you can see exactly where the marks are.

Study Helper Hints first, answers after you try

Stuck on this one? Ask for a hint and I’ll point you in the right direction, without giving the answer away. Once you’ve checked your answer, I’ll show you how the marks are awarded.