
Level:
Correct: 0
Incorrect: 0
Marks: 0/0
Exam Practice
Course:
Topics:
AQA A-Level Biology (Paper 3) Smart practice A mixed round aimed at your weak spots
Unit 1
Required practical activities
Unit 2
Practical and mathematical skills
Unit 3
Critical analysis of experimental data
Unit 4
The essay
Avg
score:
–
Topics
done:
0/26

Measurement, uncertainty and percentage error

Practise 18 exam-style questions on Measurement, uncertainty and percentage error for AQA A-Level Biology (Paper 3). Write your answer as you would in the exam and get it marked in seconds against the mark scheme, point by point, with the Study Helper on hand if you get stuck.

  • 18 questions
  • 1–8 marks each
  • Instant marking
  • No sign-up needed
18 questions, marked as you go

Sample questions with model answers

Here are 4 of the questions in this topic, each with a model answer, an explanation of why it earns the marks and the mark scheme an examiner would use.

Question 1

2 marks

A digital thermometer displays temperatures to 0.1 °C. Its manufacturer states that each reading is within ±0.5 °C of the true temperature.

Explain what is meant by the resolution of a measuring instrument.

Explain why a student using this thermometer should record the uncertainty of each reading as ±0.5 °C and not as ±0.05 °C.

Model answer

The resolution is the smallest change in temperature that produces a change in the reading - here 0.1 °C.

The uncertainty depends on more than the resolution: the manufacturer says the true temperature may be up to 0.5 °C from the displayed value (its tolerance or calibration), so ±0.05 °C, half the resolution, is only the smallest possible uncertainty and would be unrealistically small.

Explanation

Resolution and uncertainty are different. Half the smallest division (or last digit) is the minimum uncertainty of a reading, but other factors, such as the manufacturer's tolerance, calibration and the way the instrument is used, can make the real uncertainty larger. An instrument that shows many decimal places is not necessarily accurate.

Mark scheme
  1. 1 mark

    Resolution is the smallest change in the quantity being measured that gives a (perceptible) change in the reading

    Accept 'the smallest change the instrument can detect / display' (0.1 °C for this thermometer). Do not accept 'how accurate the instrument is'.

  2. 1 mark

    The uncertainty also depends on (the manufacturer's tolerance / calibration of) the instrument: the true value could be up to 0.5 °C from the reading, so ± half the resolution is only the minimum possible uncertainty

    Accept 'the thermometer may be inaccurate by up to 0.5 °C even though it displays 0.1 °C'. Ignore 'the student may misread it' (a digital display is not misread).
Question 2

3 marks

A student wanted to find the mean mass of a radish seed. She used a digital balance with a resolution of 0.01 g; the uncertainty in each reading is ±0.005 g. Instead of weighing single seeds, she weighed 100 seeds together. Their mass was 1.03 g.

Calculate the percentage uncertainty in the mass of the 100 seeds.

Explain why the student did not weigh a single seed with this balance.

Give one disadvantage of weighing the seeds together rather than one at a time.

Model answer

Uncertainty of the reading = ± half the resolution = ±0.005 g
Percentage uncertainty = 0.005 ÷ 1.03 × 100 = 0.49%
(Mean mass of one seed = 1.03 ÷ 100 = 0.0103 g = 10.3 mg)

A single seed has a mass of only about 0.01 g, the same as the resolution of the balance, so a single reading would have a percentage uncertainty of about 50%.

Weighing the seeds together gives only the mean mass: it gives no information about how much the masses of individual seeds vary, so the range or standard deviation cannot be found.

Explanation

Measuring many identical items together and dividing is a standard way to reduce percentage uncertainty: the absolute uncertainty of the one reading (±0.005 g) is shared between 100 seeds, so the percentage uncertainty of the mean mass per seed is the same small 0.49%. The cost is information: a single total cannot show the spread of the individual values or reveal unusual seeds, so it could not be used, for example, to compare the variation in seed mass of two varieties.

Mark scheme
  1. 1 mark

    0.49 (%); a correct answer of 0.49 with no working scores this mark

    Max 3. A correct answer of 0.49% with no working scores this mark. Accept 0.485 or 0.5 (from 0.005 ÷ 1.03 × 100). Do not accept 0.97 (±0.01 g used instead of the stated ±0.005 g) or 0.0049 (not multiplied by 100).

  2. 1 mark

    A single seed has a mass (about 0.01 g) similar to the resolution of the balance, so the percentage uncertainty would be very large (about 50%) / the balance could not detect differences between seeds

    Accept 'one seed would read only 0.01 g' or 'the reading would be too uncertain to be useful'. Ignore 'the seed is too light' unless linked to the resolution or uncertainty.

  3. 1 mark

    It gives no information about the variation in mass between individual seeds / the range or standard deviation of the seed masses cannot be found (e.g. for a statistical test)

    Points 3 and 4: max 1. List rule: if more than one disadvantage is given, a wrong or contradictory extra answer cancels the correct one. Ignore 'it takes longer' or 'seeds may be lost' unqualified.

  4. 1 mark

    Unusual (anomalous) seeds, e.g. very small, empty or damaged seeds, cannot be identified or left out

Question 3

4 marks

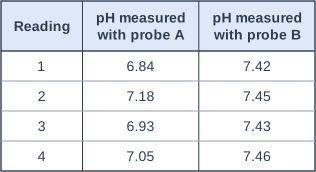
A student tested two pH probes, A and B, by measuring the pH of a buffer solution four times with each probe. The pH of the buffer solution is exactly 7.00.

The table shows her readings.

Compare the accuracy and the precision of the readings from the two probes.

Name the type of error most likely to explain the readings from probe B, and suggest what the student should do before using probe B again.

Table with columns "Reading", "pH measured with probe A", "pH measured with probe B". Reading: 1; pH measured with probe A: 6.84; pH measured with probe B: 7.42 | Reading: 2; pH measured with probe A: 7.18; pH measured with probe B: 7.45 | Reading: 3; pH measured with probe A: 6.93; pH measured with probe B: 7.43 | Reading: 4; pH measured with probe A: 7.05; pH measured with probe B: 7.46.

Model answer

Probe A is more accurate: the mean of its readings is 7.00, the true value, whereas probe B's readings all lie between 7.42 and 7.46 (mean 7.44), about 0.4 too high. Probe B is more precise: its readings have a range of only 0.04, compared with 0.34 for probe A.

Probe B has a systematic error. Before using it again, the student should calibrate it with buffer solutions of known pH (for example pH 7.00 and pH 4.00).

Explanation

Accuracy is how close a result is to the true value; precision is how little the readings spread about their mean, and depends only on random errors. Probe B is precise but inaccurate, the sign of a systematic error, which shifts every reading by the same amount. Repeating readings reduces the effect of random errors but cannot remove a systematic error; calibration against standards of known value can.

Mark scheme
  1. 1 mark

    Probe A is more accurate: its mean (7.00) is equal to the true value, but the mean for probe B (7.44) is not

    Accept 'probe A's readings are spread around the true value but probe B's are all above it'. Need a comparison of accuracy for this mark. Reject 'probe B is more accurate'.

  2. 1 mark

    Probe B is more precise: its readings have less spread (range 0.04 compared with 0.34 for probe A)

    Accept 'probe B's readings are closer together / more consistent'. Reject 'probe A is more precise'. Ignore 'probe B is more reliable'.

  3. 1 mark

    Systematic error

    Accept 'calibration error' or 'zero error'. Reject 'random error'.

  4. 1 mark

    Calibrate probe B (using buffer solutions of known pH)

    Accept 'check it against a buffer of known pH and adjust it to read 7.00'. Do not accept 'repeat the readings and calculate a mean' (repeats do not remove a systematic error).

Question 4

4 marks

A student compared the growth of young locusts (nymphs) fed on two different diets, A and B. She put 20 locusts on each diet and weighed each group of 20 together, at the start and again after 24 hours, on a balance with a resolution of 0.01 g.
- Diet A: 2.46 g at the start, 2.71 g after 24 hours.
- Diet B: 2.52 g at the start, 2.78 g after 24 hours.

The uncertainty in each reading on the balance is ±0.005 g. The student concluded that diet B produces faster growth than diet A.

Calculate the increase in mass of each group and the uncertainty in each increase.

Use your answers to evaluate the student's conclusion.

Model answer

Diet A: 2.71 - 2.46 = 0.25 g; diet B: 2.78 - 2.52 = 0.26 g
Each increase is the difference between two readings of ±0.005 g, so the uncertainty is ±0.01 g.
Diet A: 0.25 ± 0.01 g (0.24 to 0.26 g); diet B: 0.26 ± 0.01 g (0.25 to 0.27 g)

The two ranges overlap, so the difference of 0.01 g could be caused entirely by measurement uncertainty and does not show that diet B produces faster growth. Also, there was only one group on each diet, so the student cannot tell whether the difference is repeatable.

Explanation

When two results are compared, work out the range each could lie in (value ± uncertainty). If the ranges overlap, the measurements cannot show a real difference. Here each increase is a difference of two readings, so the uncertainties of both readings are added. Percentage increases (10.2% and 10.3%) show the same thing, and with only one group per diet there is no evidence of repeatability.

Mark scheme
  1. 1 mark

    Increase in mass: diet A 0.25 g AND diet B 0.26 g; correct answers with no working score this mark

    Max 4. Points 1 and 2 are the calculations: correct answers (0.25 g and 0.26 g; ±0.01 g) with no working score these marks. Points 3 to 7 (the evaluation): max 2.

  2. 1 mark

    Uncertainty in each increase = ±0.01 g (the sum of the uncertainties of two readings)

    Do not accept ±0.005 g for this point.

  3. 1 mark

    The ranges overlap (0.24 to 0.26 g and 0.25 to 0.27 g), so the difference could be caused by measurement uncertainty / there may be no real difference, so the conclusion is not supported

    Accept 'the difference (0.01 g) is no bigger than the uncertainty'. ECF: credit a correct statement about overlap based on the candidate's own uncertainty value.

  4. 1 mark

    Only one group was used for each diet / there were no repeats

    Points 4 to 7: 1 mark each. Accept 'one batch of locusts per diet'.

  5. 1 mark

    The groups had different starting masses, so percentage increase should be compared (about 10.2% and 10.3%, almost the same)

    Accept the percentages if calculated correctly.

  6. 1 mark

    No statistical test was done, so the difference may be due to chance

    Reject 'the results are due to chance'.

  7. 1 mark

    Other variables (e.g. temperature, the amount of food, the age or stage of the locusts) may not have been controlled

    Credit one named variable. Ignore 'it is not a fair test' unqualified.

Ready to try the rest? Every answer you write is marked against the mark scheme, so you can see exactly where the marks are.

Study Helper Hints first, answers after you try

Stuck on this one? Ask for a hint and I’ll point you in the right direction, without giving the answer away. Once you’ve checked your answer, I’ll show you how the marks are awarded.