
Level:
Correct: 0
Incorrect: 0
Marks: 0/0
Exam Practice
Course:
Topics:
AQA A-Level Biology (Paper 3) Smart practice A mixed round aimed at your weak spots
Unit 1
Required practical activities
Unit 2
Practical and mathematical skills
Unit 3
Critical analysis of experimental data
Unit 4
The essay
Avg
score:
–
Topics
done:
0/26

Required practical 10: choice chambers and mazes

Practise 15 exam-style questions on Required practical 10: choice chambers and mazes for AQA A-Level Biology (Paper 3). Write your answer as you would in the exam and get it marked in seconds against the mark scheme, point by point, with the Study Helper on hand if you get stuck.

  • 15 questions
  • 1–7 marks each
  • Instant marking
  • No sign-up needed
15 questions, marked as you go

Sample questions with model answers

Here are 4 of the questions in this topic, each with a model answer, an explanation of why it earns the marks and the mark scheme an examiner would use.

Question 1

1 mark

A student investigated whether blowfly larvae (maggots) move away from light. She covered half of the lid of a choice chamber with black paper and placed a bench lamp with a filament bulb above the chamber. She put 20 maggots into the centre of the chamber. After 10 minutes, 17 maggots were in the covered half.

Which change to her method would most improve the validity of her conclusion that maggots move away from light?

Choose your answer.

  • Count after 20 minutes instead of 10
  • Use a larger choice chamber
  • Put a tank of water between the lamp and the chamber
  • Record the results as percentages

Model answer

Put a tank of water between the lamp and the chamber

Explanation

A valid conclusion needs the independent variable (light) to be the only factor that differs between the two halves. A filament lamp gives out heat as well as light, so the lit half may be warmer and the maggots could be responding to temperature instead. A heat filter such as a tank of water, or a lamp that gives out little heat (an LED), together with a thermometer reading in each half, removes this confounding variable. Changing the time or the way the results are presented does not.

Mark scheme
  1. 1 mark

    Put a tank of water between the lamp and the chamber

    The only correct answer is 'Put a tank of water between the lamp and the chamber'. A filament lamp also heats the uncovered half, so the maggots may be moving away from the higher temperature rather than the light; the tank of water absorbs heat (a heat filter), so light intensity is the only factor that differs between the halves. Counting after 20 minutes, using a larger chamber and recording percentages do not remove this second variable. If more than one option is given, do not award the mark.
Question 2

3 marks

A student investigated the temperature preference of flour beetles. She made a temperature gradient along a metal tray covered with a thin layer of flour, by standing one end of the tray on a hot plate and the other end on ice. She divided the tray into six zones of equal size and measured the temperature in the middle of each zone with a thermometer. She then placed 60 beetles in the middle of the tray. After 30 minutes, she counted the beetles in each zone.

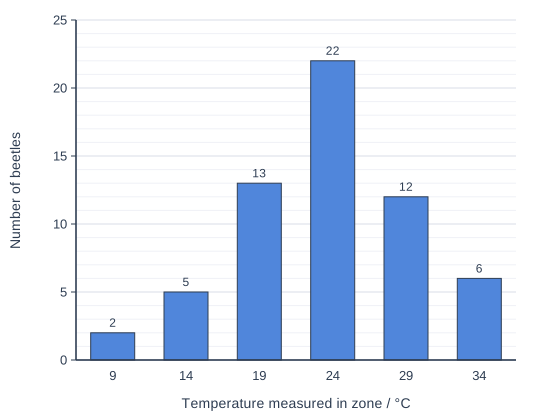
The bar chart shows her results. Each bar is labelled with the temperature she measured in that zone.

She concluded that flour beetles prefer a temperature of 24 °C. Evaluate her conclusion.

Bar chart of number of beetles for each temperature measured in zone / °C: 9 2, 14 5, 19 13, 24 22, 29 12, 34 6.

Model answer

The conclusion is partly supported, because the largest number of beetles, 22, was in the 24 °C zone. However, only 22 of the 60 beetles (37%) were in this zone, and 47 were in the zones from 19 °C to 29 °C, so the beetles seem to prefer a range of temperatures rather than exactly 24 °C. The temperature was measured only once, in the middle of each zone and before the beetles were added, so it may have changed during the 30 minutes as the ice melted. The beetles also started in the middle of the tray, next to the 24 °C zone, and there was only one trial with no statistical test.

Explanation

Evaluating a conclusion means weighing what supports it against the limitations of the data and the method. Here each zone is a range of temperatures, the gradient was measured only once and may have drifted, and the starting position of the beetles may have biased where they ended up. Quote figures from the chart to support each point.

Mark scheme
  1. 1 mark

    Supports: the largest number of beetles (22) was in the 24 °C zone

    Max 3, with at most 2 marks from points 2 to 7 (against the conclusion), so full marks need point 1.

  2. 1 mark

    Only 22 of the 60 beetles (37%) were in this zone OR many beetles were in the 19 °C and 29 °C zones, so the beetles prefer a range of temperatures (about 19 to 29 °C), not one temperature

    Accept '47 of the 60 beetles were in the zones from 19 °C to 29 °C'.

  3. 1 mark

    Temperature was measured only at the middle of each zone / each zone covers a range of temperatures

  4. 1 mark

    Temperature was measured only before the beetles were added / the gradient may have changed during the 30 minutes (e.g. as the ice melted or the tray heated up)

  5. 1 mark

    The beetles were placed in the middle of the tray, next to the 19 °C and 24 °C zones, so some may be there because they did not move far

    Accept 'the starting position may have biased the result'.

  6. 1 mark

    Another factor may vary along the tray, e.g. the flour may be drier / humidity may be lower at the hot end

  7. 1 mark

    Only one trial / no repeats / no statistical test, so the difference may be due to chance

    Reject 'the results are due to chance'.

Question 3

4 marks

A student set up a choice chamber with damp paper towel below the gauze in one half and anhydrous calcium chloride, a drying agent, below the gauze in the other half. When cobalt chloride paper showed that a humidity gradient had formed, she added 30 woodlice through the central hole. She counted the woodlice in the humid half every 2 minutes for 20 minutes.

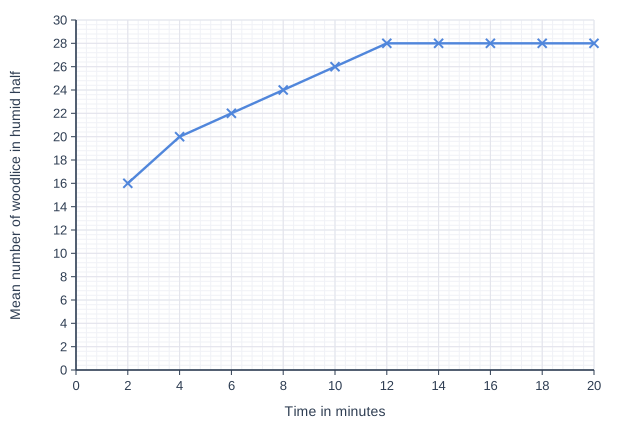
She did this five times, using new woodlice each time, and calculated the mean number of woodlice in the humid half at each time. The graph shows her results.

Calculate the mean rate of increase in the number of woodlice in the humid half between 2 minutes and 12 minutes. Give your answer in woodlice per minute.

Woodlice respond to humidity by a kinesis. Use this to explain the shape of the curve between 2 minutes and 12 minutes.

Suggest why she used new woodlice for each repeat.

Line graph of mean number of woodlice in humid half (y-axis, 0 to 30) against time in minutes (x-axis, 0 to 20). The line joins the points (2, 16), (4, 20), (6, 22), (8, 24), (10, 26), (12, 28), (14, 28), (16, 28), (18, 28), (20, 28).

Model answer

Rate = (28 - 16) ÷ (12 - 2) = 12 ÷ 10 = 1.2 woodlice per minute

In the dry half the woodlice move faster and change direction more often, so they tend to leave the dry half. When they reach the humid half they slow down and become less active, so they stay there. Their movement is random, not directed towards the humid half, so the number in the humid half rises gradually rather than all at once.

The woodlice used in one trial might be tired, stressed or dehydrated, which could change how they respond in the next trial; using new woodlice keeps each repeat independent.

Explanation

A kinesis is a non-directional response: the speed of movement or the rate of turning changes with the intensity of the stimulus. Woodlice keep moving quickly in dry air and slow down in humid air, so they gradually accumulate in the humid half and the curve rises and then levels off. Mean rate = change in number ÷ time taken. A common error is to describe a kinesis as 'moving towards the humid side', which describes a taxis.

Mark scheme
  1. 1 mark

    1.2 (woodlice per minute); a correct answer with no working scores this mark

    Max 4: point 1, max 2 from points 2 to 4, and point 5. Correct method: (28 - 16) ÷ (12 - 2) = 12 ÷ 10. A correct answer of 1.2 with no working scores this mark. Do not accept 2.3 (28 ÷ 12) or 1.3 (16 ÷ 12).

  2. 1 mark

    In the dry half, woodlice move faster / are more active / change direction (turn) more often, so they are more likely to leave the dry half

    Points 2 to 4: max 2. Also accept 'turn less often / move in straighter lines' in the dry half, which also takes them out of it. Do not accept 'woodlice move towards the humid half' (this describes a taxis).

  3. 1 mark

    In the humid half, woodlice move more slowly / stop / are less active, so they stay there / accumulate there

    Accept 'they become less active in humid air'. Accept a change in the rate of turning in the humid half only if it is linked to the woodlice staying there.

  4. 1 mark

    The movement is random / not directed towards the humid half, so woodlice reach the humid half by chance and the number rises gradually (rather than all at once)

    Accept 'it takes time for random movement to bring them into the humid half'.

  5. 1 mark

    The same woodlice might have been affected by the previous trial, e.g. tired / stressed / dehydrated / less responsive OR so that each repeat is independent (of the one before)

    Accept 'woodlice might remember or learn the layout of the chamber'. Ignore 'to make it fair' unqualified.

Question 4

6 marks

Fruit flies (Drosophila) are attracted to the odours of fermenting fruit. A student wants to find out whether fruit flies move towards the odour of cider vinegar.

She has a T-maze made of clear plastic tubes: a start tube joined at a junction to two side tubes of equal length. The far end of each side tube can be closed with a cotton wool plug. She also has cider vinegar, distilled water, filter paper and a culture of about 200 fruit flies.

Describe how she could carry out this investigation. Your answer should include how she would make sure her results are valid and how she would analyse them.

Model answer

1. Soak a piece of filter paper in cider vinegar and fix it at the end of one side tube, with the plug in place. Soak an identical piece in the same volume of distilled water and fix it at the end of the other side tube.
2. Tap 20 flies from the culture into the start tube and let them move up to the junction.
3. After 2 minutes, block the junction and count the flies in each side tube.
4. Do the test in the dark (or in even light) at a constant temperature, so the odour is the only difference between the side tubes.
5. Swap the vinegar and water between the side tubes for half of the trials, and use clean tubes and fresh filter paper for each trial so no odour is left behind.
6. Carry out a control with distilled water in both side tubes to check that the flies split evenly.
7. Repeat with new flies each time, and return the flies to the culture afterwards.
8. Add up the numbers in each tube and use a chi-squared test to compare the observed numbers with the expected equal numbers.

Explanation

A maze investigation needs a control arm that differs only in the independent variable (water instead of vinegar), conditions such as light and temperature kept the same, the stimulus swapped between sides to rule out a side preference, and cleaning between trials to remove odours. The data are counts in categories compared with expected counts, so a chi-squared test is the right statistical test. Ethical handling and returning the animals to their culture are also expected.

Mark scheme
  1. 1 mark

    Filter paper soaked in cider vinegar at the end of one side tube AND filter paper soaked in (the same volume of) distilled water at the end of the other side tube

    Max 6. Accept the vinegar paper attached to one plug and the water paper to the other.

  2. 1 mark

    Put a (known) number of flies into the start tube (e.g. 20 flies, or one at a time) so they can move to the junction

  3. 1 mark

    After a set time (e.g. 2 minutes), close / block the side tubes and count the flies in each side tube

    Accept 'record which tube each fly enters' if flies are tested one at a time.

  4. 1 mark

    Keep other conditions the same in both side tubes, e.g. even light / test in the dark / same temperature

    Ignore 'keep everything the same' unqualified.

  5. 1 mark

    Swap the vinegar and the water between the side tubes for half of the trials (to control for a side preference)

  6. 1 mark

    Clean the tubes / use new tubes and new filter paper between trials (to remove odour left behind)

  7. 1 mark

    Repeat several times with new flies each time and calculate a mean / total

    Accept 'use a large number of flies in total'.

  8. 1 mark

    Control trial with distilled water in both side tubes, to show that the flies split evenly between the tubes

    Accept a control with nothing in either side tube.

  9. 1 mark

    Use a chi-squared test to compare the observed numbers in each side tube with the expected (equal) numbers

    Accept 'χ² test'. Do not accept a t-test or correlation coefficient.

  10. 1 mark

    Treat the flies ethically, e.g. return them to the culture after counting / keep them in the maze for as short a time as possible

Ready to try the rest? Every answer you write is marked against the mark scheme, so you can see exactly where the marks are.

Study Helper Hints first, answers after you try

Stuck on this one? Ask for a hint and I’ll point you in the right direction, without giving the answer away. Once you’ve checked your answer, I’ll show you how the marks are awarded.