Level:
Correct: 0
Incorrect: 0
Marks: 0/0
Exam Practice
Course:
Topics:
AQA A-Level Biology (Paper 3) Smart practice A mixed round aimed at your weak spots
Unit 1
Required practical activities
Unit 2
Practical and mathematical skills
Unit 3
Critical analysis of experimental data
Unit 4
The essay
Avg
score:
–
Topics
done:
0/26

Mean, standard deviation and error bars

Practise 18 exam-style questions on Mean, standard deviation and error bars for AQA A-Level Biology (Paper 3). Write your answer as you would in the exam and get it marked in seconds against the mark scheme, point by point, with the Study Helper on hand if you get stuck.

  • 18 questions
  • 1–7 marks each
  • Instant marking
  • No sign-up needed
18 questions, marked as you go

Sample questions with model answers

Here are 4 of the questions in this topic, each with a model answer, an explanation of why it earns the marks and the mark scheme an examiner would use.

Question 1

2 marks

A student counted the number of chloroplasts in 10 palisade mesophyll cells in a thin section of a leaf, using an optical microscope. One of the cells had been cut through when the section was made, so only part of it was visible.

Her counts were:
42   38   45   17   40   44   39   41   46   43

Calculate the mean number of chloroplasts per cell. Give your answer to 1 decimal place.

Model answer

The count of 17 is from the cell that had been cut, so it is left out.
Total of the other nine counts = 42 + 38 + 45 + 40 + 44 + 39 + 41 + 46 + 43 = 378
Mean = 378 ÷ 9 = 42.0 chloroplasts per cell

Explanation

A mean should include every valid result, but a value can be left out if there is a known reason why it is wrong: here only part of one cell was visible, so its count of 17 is far too low. Including it gives 39.5, which underestimates the mean. Always show which values you used.

Mark scheme
  1. 1 mark

    Correct method: the total of the nine counts without 17, divided by 9, e.g. 378 ÷ 9; or a correct final answer of 42.0 with no working

    A correct answer of 42.0 with no working scores 2 marks (points 1 and 2). Accept for 1 mark: 42 (not given to 1 decimal place) OR 39.5 (the count of 17 from the cut cell included) OR a correct method with an arithmetic error. The count of 17 comes from the cell that had been cut, so only part of it was counted.

  2. 1 mark

    42.0

    Do not accept 42 (not given to 1 decimal place) for this mark, but award point 1.
Question 2

2 marks

A farmer weighed 200 newborn lambs of one breed. The mean birth mass was 4.6 kg and the standard deviation was 0.7 kg.

A student wrote: 'This means that every lamb had a birth mass between 3.9 kg and 5.3 kg.'

Explain why the student is wrong.

Model answer

The standard deviation measures how spread out the birth masses are around the mean; it does not give the lightest and heaviest lambs. Mean ± 2 standard deviations, 3.2 to 6.0 kg, includes over 95% of the lambs, so many lambs have masses outside 3.9 to 5.3 kg (only about two thirds lie within one standard deviation of the mean), and a few may even be outside 3.2 to 6.0 kg.

Explanation

The standard deviation is not a range. In a normal distribution, about two thirds of values lie within one standard deviation of the mean and over 95% lie within two, so it is quite normal for values to be more than one standard deviation from the mean.

Mark scheme
  1. 1 mark

    The standard deviation is a measure of the spread of the values around the mean; it does not give the lowest and highest values

    Accept "the range gives the lowest and highest values, not the standard deviation".

  2. 1 mark

    Mean ± 2 standard deviations (3.2 to 6.0 kg) includes over 95% of the lambs, so many lambs are outside 3.9 to 5.3 kg / only about two thirds of the values lie within 1 standard deviation of the mean

    Accept "some lambs may even be lighter than 3.2 kg or heavier than 6.0 kg".

Question 3

3 marks

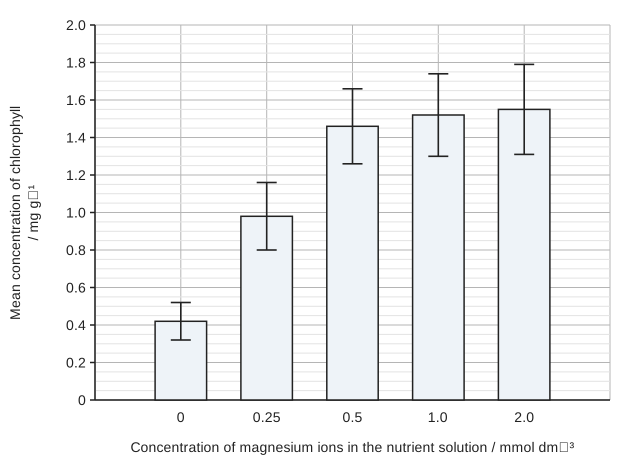
Scientists grew barley seedlings in nutrient solutions containing different concentrations of magnesium ions, with 8 seedlings in each solution. After 3 weeks they measured the concentration of chlorophyll in the leaves. The figure shows their results. The error bars show ± 2 standard deviations from the mean; this range includes over 95% of the data.

A student concluded that every increase in the concentration of magnesium ions increased the concentration of chlorophyll in the leaves. Use the figure to evaluate this conclusion.

A bar chart of mean concentration of chlorophyll in mg g⁻¹ (y-axis, 0 to 2.0, grid lines every 0.05) for five concentrations of magnesium ions in the nutrient solution in mmol dm⁻³ (x-axis): 0, 0.25, 0.5, 1.0 and 2.0. Each bar has an error bar. The bars increase from 0 to 0.5 mmol dm⁻³ and are then about the same height at 0.5, 1.0 and 2.0 mmol dm⁻³. The top and bottom of each error bar can be read from the grid.

Model answer

The conclusion is only partly supported. The error bars for 0 and 0.25 mmol dm⁻³, and for 0.25 and 0.5 mmol dm⁻³, do not overlap, so these increases in chlorophyll concentration are unlikely to be due to chance. However, the error bars for 0.5, 1.0 and 2.0 mmol dm⁻³ overlap, so the small differences between these means may be due to chance: above 0.5 mmol dm⁻³, increasing the magnesium concentration may have no effect.

Explanation

Error bars showing ± 2 standard deviations give a quick indication of significance: no overlap suggests the difference between two means is not due to chance, and overlap suggests it may be. Evaluate a conclusion by finding the parts of the data that support it and the parts that do not. Here the chlorophyll concentration levels off, so "every increase" is not supported.

Mark scheme
  1. 1 mark

    The error bars for 0 and 0.25 mmol dm⁻³ (or for 0.25 and 0.5 mmol dm⁻³) do not overlap

    Max 3, with at most 2 marks from points 1 and 2 (for the conclusion) and at most 2 marks from points 3 to 5 (against it).

  2. 1 mark

    So (these) increases in chlorophyll concentration are unlikely to be due to chance / are significant

    Reject "the results are significant".

  3. 1 mark

    The error bars for 0.5, 1.0 and 2.0 mmol dm⁻³ overlap

    Accept any two of these concentrations.

  4. 1 mark

    So the differences between these means may be due to chance / are not significant, so increases above 0.5 mmol dm⁻³ may have no effect

    Accept "chlorophyll concentration levels off above 0.5 mmol dm⁻³". Reject "the results are due to chance".

  5. 1 mark

    No statistical test was carried out, so the significance of the differences has not been confirmed

    Accept "a t-test is needed to confirm whether the differences are significant".

Question 4

4 marks

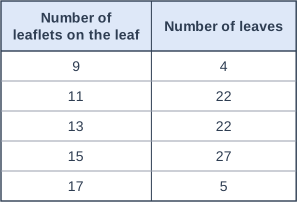
A student counted the number of leaflets on each of 80 leaves collected at random from one rowan tree. The table shows her results.

Calculate the mean number of leaflets per leaf. Give your answer to 1 decimal place.

Give the mode of the number of leaflets per leaf.

The student wrote: 'The mode shows that most leaves on this tree have 15 leaflets.' Use the table to explain why this statement is not correct.

Table with columns "Number of leaflets on the leaf", "Number of leaves". Number of leaflets on the leaf: 9; Number of leaves: 4 | Number of leaflets on the leaf: 11; Number of leaves: 22 | Number of leaflets on the leaf: 13; Number of leaves: 22 | Number of leaflets on the leaf: 15; Number of leaves: 27 | Number of leaflets on the leaf: 17; Number of leaves: 5.

Model answer

Total number of leaflets = (9 × 4) + (11 × 22) + (13 × 22) + (15 × 27) + (17 × 5) = 36 + 242 + 286 + 405 + 85 = 1054
Mean = 1054 ÷ 80 = 13.175 = 13.2 leaflets per leaf

Mode: the most common number of leaflets is 15 (27 leaves). Mode = 15 leaflets.

The statement is wrong because only 27 of the 80 leaves (about a third) have 15 leaflets; the other 53 do not. Leaves with 11 or 13 leaflets are almost as common (22 each), so the mode is only slightly more common than other values.

Explanation

To find the mean from a frequency table, multiply each value by its frequency, add these up and divide by the total frequency (80 leaves, not 5 classes). The mode is the value with the highest frequency (15, not its frequency of 27). The mode is only the most common value: it need not be the value of most of the data, and here it describes only a third of the leaves.

Mark scheme
  1. 1 mark

    Correct method: (9 × 4 + 11 × 22 + 13 × 22 + 15 × 27 + 17 × 5) ÷ 80 = 1054 ÷ 80; or a correct final answer of 13.2 with no working

    A correct mean of 13.2 with no working scores 2 marks (points 1 and 2). Accept for 1 mark: 13.175 or 13.18 (not given to 1 decimal place) OR evidence of 1054 (the total number of leaflets) with an error in the division. Do not award any mark for 13 obtained as the mean of the five leaflet numbers, or for 16 (the mean of the numbers of leaves).

  2. 1 mark

    13.2

    Do not accept 13.175, 13.18 or 13 for this mark.

  3. 1 mark

    Mode = 15

    Do not accept 27 (the number of leaves that had 15 leaflets).

  4. 1 mark

    Only 27 of the 80 leaves (about a third / 34%) have 15 leaflets, so most leaves (53 of 80) do not / 11 and 13 leaflets are almost as common (22 leaves each)

    The answer must use figures from the table. Accept 'the mode is only the most common value, not the value of more than half of the leaves' with a figure from the table. Ignore 'the mean is 13.2' on its own.

Ready to try the rest? Every answer you write is marked against the mark scheme, so you can see exactly where the marks are.

Study Helper Hints first, answers after you try

Stuck on this one? Ask for a hint and I’ll point you in the right direction, without giving the answer away. Once you’ve checked your answer, I’ll show you how the marks are awarded.