
Level:
Correct: 0
Incorrect: 0
Marks: 0/0
Exam Practice
Course:
Topics:
AQA A-Level Biology (Paper 3) Smart practice A mixed round aimed at your weak spots
Unit 1
Required practical activities
Unit 2
Practical and mathematical skills
Unit 3
Critical analysis of experimental data
Unit 4
The essay
Avg
score:
–
Topics
done:
0/26

Data analysis: nerves, muscles and homeostasis

Practise 14 exam-style questions on Data analysis: nerves, muscles and homeostasis for AQA A-Level Biology (Paper 3). Write your answer as you would in the exam and get it marked in seconds against the mark scheme, point by point, with the Study Helper on hand if you get stuck.

  • 14 questions
  • 5–10 marks each
  • Instant marking
  • No sign-up needed
14 questions, marked as you go

Sample questions with model answers

Here are 4 of the questions in this topic, each with a model answer, an explanation of why it earns the marks and the mark scheme an examiner would use.

Question 1

6 marks

Scientists investigated the effect of glucose concentration on the secretion of insulin and glucagon. They removed islets of Langerhans from the pancreases of mice and incubated samples of the islets in solutions with different concentrations of glucose for 1 hour. They measured the mass of each hormone secreted, as a percentage of the maximum secretion of that hormone.

The graph shows their results. The normal blood glucose concentration of a mouse is about 7 mmol dm⁻³.

Use the graph to explain how the secretion of these two hormones helps to keep the blood glucose concentration close to 7 mmol dm⁻³.

Suggest one advantage of investigating isolated islets in solutions, rather than measuring the concentrations of the hormones in the blood of living mice.

Suggest two reasons why these results may not show how the pancreas responds to changes in blood glucose concentration in a living mouse.
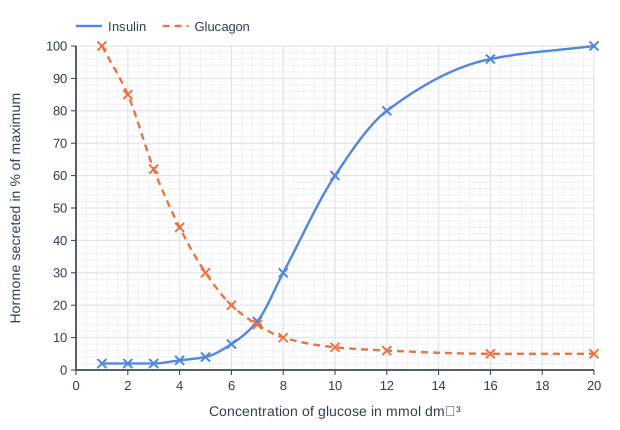
Line graph of hormone secreted in % of maximum (y-axis, 0 to 100) against concentration of glucose in mmol dm⁻³ (x-axis, 0 to 20). "Insulin" is a smooth curve through (1, 2), (2, 2), (3, 2), (4, 3), (5, 4), (6, 8), (7, 15), (8, 30), (10, 60), (12, 80), (16, 96), (20, 100). "Glucagon" (dashed) is a smooth curve through (1, 100), (2, 85), (3, 62), (4, 44), (5, 30), (6, 20), (7, 14), (8, 10), (10, 7), (12, 6), (16, 5), (20, 5).

Model answer

At 7 mmol dm⁻³ both hormones are secreted at a low rate (insulin 15%, glucagon 14%). When the glucose concentration rises above 7, insulin secretion increases steeply (60% at 10 mmol dm⁻³) while glucagon secretion falls further (10% at 8). Insulin causes cells to take up glucose and the liver to convert glucose to glycogen, so the concentration falls back to normal. When the glucose concentration falls below 7, glucagon secretion increases (44% at 4 mmol dm⁻³) and insulin secretion falls (3%), so the blood glucose concentration rises. Having two hormones with opposite effects gives separate negative feedback mechanisms for a rise and a fall, so control is greater.

Using isolated islets lets the scientists keep the glucose concentration constant at each chosen value, which is not possible in a living mouse, where it is regulated.

In a living mouse the islets also receive nerve impulses and other hormones, such as adrenaline, that affect their secretion; and the islets may have been damaged when they were removed.

Explanation

Blood glucose is controlled by negative feedback with two separate mechanisms: insulin lowers a high concentration and glucagon raises a low one, which gives finer control than one hormone alone. The graph shows the 'switch-over' close to the normal concentration. Use readings from the graph to support each point. Isolated islets let the glucose concentration be controlled exactly, but they lack the nerves, other hormones and blood flow of a living animal, so the same feature is both an advantage and a limitation. Do not confuse glucagon, glycogen and glucose.

Mark scheme
  1. 1 mark

    When the glucose concentration rises above 7 mmol dm⁻³, insulin secretion increases (steeply), e.g. from 15% at 7 to 60% at 10 mmol dm⁻³

    Max 5 if the answer does not quote any value read from the graph. Max 6. Points 1 to 5: max 3. Accept readings within 3% of the graph values: insulin 2, 2, 2, 3, 4, 8, 15, 30, 60, 80, 96, 100% and glucagon 100, 85, 62, 44, 30, 20, 14, 10, 7, 6, 5, 5% at 1, 2, 3, 4, 5, 6, 7, 8, 10, 12, 16, 20 mmol dm⁻³.

  2. 1 mark

    Insulin causes cells to take up more glucose / the liver to convert glucose to glycogen (glycogenesis), so the blood glucose concentration falls back (to normal)

    Accept 'more glucose channel proteins in cell-surface membranes'. Reject glucagon or glycogenolysis in this context.

  3. 1 mark

    When the glucose concentration rises, glucagon secretion falls / stays low (e.g. 10% at 8 mmol dm⁻³), so less glycogen is converted to glucose

  4. 1 mark

    When the glucose concentration falls below 7 mmol dm⁻³, glucagon secretion increases (e.g. 44% at 4 mmol dm⁻³) and insulin secretion falls (3%), so the blood glucose concentration rises back

  5. 1 mark

    The two hormones have opposite effects / there are separate mechanisms for a rise and a fall, so (negative feedback) gives a greater degree of control

    Accept 'negative feedback' only if linked to returning glucose to normal or to the two hormones.

  6. 1 mark

    The glucose concentration around the islets can be controlled / kept constant at each chosen value (in a living mouse it changes and is regulated)

    Points 6 to 8: max 1. List rule: if more than one advantage is given, a wrong or contradictory extra answer cancels the correct one. Insufficient: 'it is easier' or 'it is more accurate' with no reason. Ignore ethical points (the mice were killed to obtain the islets).

  7. 1 mark

    A wide range of glucose concentrations (1 to 20 mmol dm⁻³) can be tested, including very low or very high concentrations that would harm a living mouse

  8. 1 mark

    The secretion by the islets is measured directly: in a living mouse, nerve impulses, other hormones and the removal of hormones from the blood would also affect the concentrations, so the effect of glucose alone could not be seen

  9. 1 mark

    In a living mouse the islets receive nerve impulses / other hormones (e.g. adrenaline) that affect secretion

    Points 9 to 11: max 2. List rule: if more than two reasons are given, each wrong or contradictory extra answer cancels one correct answer. Ignore 'not repeated' or 'small sample'. Do not accept 'mice respond differently from other mammals' (the question is about a living mouse).

  10. 1 mark

    In a living mouse the hormones are carried away in the blood / broken down, so the concentrations around the islets differ from those in the solution

  11. 1 mark

    The islets may have been damaged when removed / were kept in conditions (temperature, oxygen, only 1 hour) unlike those in the body
Question 2

7 marks

When the head of a garden snail is touched, the snail withdraws its tentacles. This is a simple reflex.

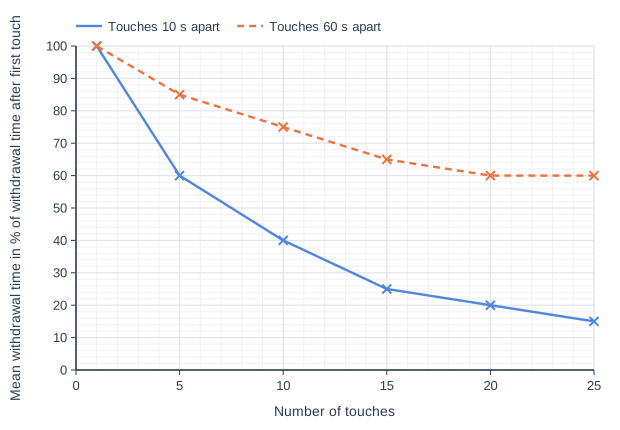
Scientists touched the head of each of 20 snails with a fine bristle 25 times. For 10 snails the touches were 10 seconds apart, and for the other 10 they were 60 seconds apart. After each touch they measured the time until the tentacles were fully extended again (the withdrawal time). The graph shows the mean withdrawal time after each touch, as a percentage of the withdrawal time after the first touch.

The scientists also found that:
- after the 25th touch, touching the snail on a different part of its body produced a full withdrawal of the tentacles
- in isolated nerve tissue, repeated stimulation of the sensory neurone produced the same action potentials each time, but the depolarisation of the postsynaptic membrane of the motor neurone became smaller each time.

Use the graph to describe the effect of the time between touches on the withdrawal time.

Suggest one advantage to the snail of this change in its response.

The scientists concluded that the decrease in withdrawal time was caused by changes at synapses, not by fatigue of the muscles or the sensory receptors. Use the information to justify this conclusion.

Suggest how changes at the synapse could result in a smaller depolarisation of the postsynaptic membrane.

Line graph of mean withdrawal time in % of withdrawal time after first touch (y-axis, 0 to 100) against number of touches (x-axis, 0 to 25). "Touches 10 s apart" joins the points (1, 100), (5, 60), (10, 40), (15, 25), (20, 20), (25, 15). "Touches 60 s apart" (dashed) joins the points (1, 100), (5, 85), (10, 75), (15, 65), (20, 60), (25, 60).

Model answer

The withdrawal time decreases with repeated touches at both intervals, but it decreases faster and further when the touches are 10 seconds apart. After 25 touches it is 15% of the first withdrawal time with touches 10 s apart but 60% with touches 60 s apart.

The snail does not waste time and energy withdrawing from a harmless stimulus that keeps being repeated, so it can carry on feeding.

Touching a different part of the body still produced a full withdrawal, so the muscles were not fatigued. The sensory neurone produced the same action potentials each time, so the receptors were still responding. Only the depolarisation of the postsynaptic membrane decreased, so the change was at the synapse.

Fewer calcium ions may enter the presynaptic knob, so fewer vesicles fuse with the membrane and less neurotransmitter is released. Fewer neurotransmitter molecules bind to receptors on the postsynaptic membrane, so fewer sodium ion channels open and the depolarisation is smaller.

Explanation

This decrease in response to a repeated harmless stimulus is called habituation; it lets an animal ignore unimportant stimuli and respond to new ones. To justify a conclusion, link each piece of evidence to what it rules out: a full response to another stimulus rules out muscle fatigue, and unchanged sensory action potentials rule out receptor fatigue. The size of the postsynaptic depolarisation depends on how much neurotransmitter is released, which depends on calcium ions entering the presynaptic knob, and on how many sodium ion channels open. Refer to sodium and calcium ions, not just 'sodium' or 'calcium'.

Mark scheme
  1. 1 mark

    The withdrawal time decreases with repeated touches at both intervals

    Max 7. Points 1 to 3: max 2. Accept 'the response gets smaller each time the snail is touched'.

  2. 1 mark

    The withdrawal time decreases faster / more when the touches are 10 seconds apart than when they are 60 seconds apart

    Accept the converse. A comparison is needed for this point.

  3. 1 mark

    Correct use of values from the graph, e.g. after 25 touches it is 15% with touches 10 s apart but 60% with touches 60 s apart

    Accept values within 2% of the graph: 10 s apart 100, 60, 40, 25, 20, 15% and 60 s apart 100, 85, 75, 65, 60, 60% at touches 1, 5, 10, 15, 20 and 25. Accept 'levels off at about 15-20% (10 s) and 60% (60 s)'.

  4. 1 mark

    The snail does not waste energy / time withdrawing in response to a harmless / unimportant stimulus, so it can keep feeding / moving

    Accept 'it can respond to new / important stimuli'. Reject 'so the snail does not get tired' with no idea of wasting energy or of harmless stimuli. List rule: if more than one advantage is given, a wrong or contradictory extra answer cancels the mark.

  5. 1 mark

    Touching a different part of the body still gave a full withdrawal, so the muscles (effectors) were not fatigued

    Points 5 to 7: max 2. Each point needs the evidence and what it rules out or shows.

  6. 1 mark

    The sensory neurone produced the same action potentials each time, so the sensory receptors / sensory neurones were not fatigued

    Accept 'still responding to the stimulus'.

  7. 1 mark

    The depolarisation of the postsynaptic membrane became smaller, so transmission at the synapse changed

  8. 1 mark

    Less neurotransmitter is released (from the presynaptic neurone) / fewer vesicles fuse with the presynaptic membrane

    Points 8 to 12: max 2. Accept 'transmitter' or 'chemical transmitter'. Accept a named neurotransmitter.

  9. 1 mark

    Fewer calcium ions enter the presynaptic knob / fewer calcium ion channels open (so fewer vesicles fuse with the membrane)

    Accept Ca²⁺. Reject 'calcium' without ions.

  10. 1 mark

    Vesicles of neurotransmitter are used up faster than they are replaced / less neurotransmitter is resynthesised between touches

    Accept 'the presynaptic neurone runs out of neurotransmitter'.

  11. 1 mark

    Fewer neurotransmitter molecules bind to receptors (on the postsynaptic membrane), so fewer sodium ion channels open / fewer sodium ions diffuse in

    Accept Na⁺.

  12. 1 mark

    There are fewer receptors on the postsynaptic membrane / the receptors become less sensitive (desensitised)

    Ignore 'the receptors stop working' without the idea of fewer or less sensitive receptors.

Question 3

7 marks

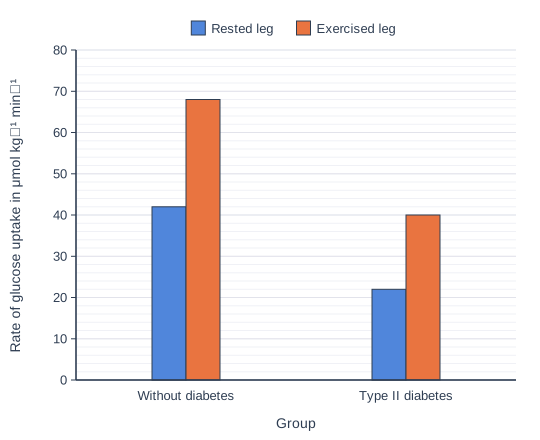
Scientists investigated the effect of a single period of exercise on the uptake of glucose by the leg muscles of 8 people with type II diabetes and 8 people without diabetes.

Each person exercised one leg only, on a kicking machine, for 60 minutes, while the other leg rested. Three hours later, the scientists infused insulin into the blood at a constant rate and infused glucose to keep the blood glucose concentration at 5 mmol dm⁻³. They then measured the rate of glucose uptake by the muscles of each leg.

The chart shows their results. The scientists also found that muscle cells in the exercised leg had more glucose transport proteins in their cell-surface membranes than those in the rested leg.

Calculate the percentage increase in the rate of glucose uptake caused by exercise in the people with type II diabetes. Give your answer to 3 significant figures.

Explain why the scientists compared the exercised leg with the rested leg of the same person, rather than comparing people who exercised with people who did not.

Explain why the scientists infused glucose to keep the blood glucose concentration at 5 mmol dm⁻³.

Explain how insulin increases the uptake of glucose by muscle cells, and suggest how the exercise increased the uptake of glucose.

Dual bar chart of rate of glucose uptake in μmol kg⁻¹ min⁻¹ for each group, comparing Rested leg and Exercised leg (a key above the chart shows which bar is which). Without diabetes: Rested leg 42, Exercised leg 68; Type II diabetes: Rested leg 22, Exercised leg 40.

Model answer

Percentage increase = (40 - 22) ÷ 22 × 100 = 18 ÷ 22 × 100 = 81.8%

Both legs receive the same blood, so they are exposed to the same insulin and glucose concentrations, and all other factors such as genotype, diet and age are the same. Each person acts as their own control, which removes the effect of variation between people, so the difference is due to the exercise.

Glucose was infused so that the blood glucose concentration stayed the same, even though insulin was being infused, so differences in uptake were caused by the muscles and not by different concentrations of glucose in the blood.

Insulin binds to receptors on the cell-surface membrane of muscle cells. This causes vesicles containing glucose channel proteins to fuse with the membrane, so more glucose enters the cells by facilitated diffusion. Exercise increased the number of glucose transport proteins in the membrane, in addition to the effect of insulin. The exercised muscle is also converting glucose to glycogen to replace the glycogen it used, which keeps the glucose concentration inside the cells low and maintains a steep concentration gradient.

Explanation

Insulin binds to receptors and causes more glucose channel proteins to be included in the cell-surface membrane, so glucose enters by facilitated diffusion; in type II diabetes cells respond less to insulin, which is why the uptake is lower. Exercise increases the number of these proteins even when insulin action is poor, which is why exercise is advised for people with type II diabetes. Comparing two legs of the same person controls every variable that differs between people; this is a stronger design than comparing different groups.

Mark scheme
  1. 1 mark

    Correct method: (40 - 22) ÷ 22 × 100; or a correct final answer of 81.8 with no working

    Max 7. A correct answer of 81.8% with no working scores 2 marks (points 1 and 2). Accept for 1 mark: 0.818 (not multiplied by 100) OR 45.0 (difference divided by 40) OR 82 or 81.82 (not given to 3 significant figures).

  2. 1 mark

    81.8 (%)

  3. 1 mark

    Both legs receive the same blood, so the same concentrations of insulin and glucose

    Points 3 to 5: max 2.

  4. 1 mark

    Other factors are the same, e.g. genotype / age / diet / body mass / severity of diabetes, so only the exercise differs

    One correct factor with the idea that it is the same for both legs is enough.

  5. 1 mark

    This removes / reduces the effect of variation between individuals (so the difference is due to the exercise)

    Accept 'each person acts as their own control'.

  6. 1 mark

    So that the blood glucose concentration (the supply of glucose to the muscles) was the same for both legs and all the people / did not fall as insulin was infused, so differences in uptake were caused by the muscles (exercise or diabetes) and not by different blood glucose concentrations

    Point 6: 1 mark. Accept 'blood glucose concentration is a control variable that affects the rate of uptake' only if it is linked to uptake. Insufficient: 'to make it fair'.

  7. 1 mark

    Insulin binds to (specific) receptors on the cell-surface membrane (of muscle cells)

    Points 7 to 11: max 2, with at most 1 mark from points 7 to 9 (how insulin acts). Reject 'insulin enters the cell'.

  8. 1 mark

    Vesicles containing glucose channel / transport proteins fuse with the cell-surface membrane, so there are more of these proteins in the membrane

    Accept 'more glucose carrier proteins / GLUT proteins inserted in the membrane'.

  9. 1 mark

    Glucose enters the cells by facilitated diffusion (down its concentration gradient)

    Reject active transport.

  10. 1 mark

    Exercise increased the number of glucose transport proteins in the membrane (in addition to the effect of insulin)

    This is from the information given: credit it only if it is linked to more glucose entering the cells (by facilitated diffusion).

  11. 1 mark

    Glucose is used in respiration / converted to glycogen to replace glycogen used in exercise, so its concentration in the cells stays low, keeping a steep concentration gradient

    Accept 'the cells need to replace their glycogen stores'.

Question 4

8 marks

Prediabetes is a condition in which a person's fasting blood glucose concentration is higher than normal, but not high enough for type II diabetes.

Scientists randomly divided 300 adults with prediabetes into three groups of 100. For 3 years:
- group A was given a leaflet of advice on diet and exercise
- group B took part in a supervised exercise programme for 150 minutes each week
- group C took part in the same exercise programme and also followed a diet with a lower energy intake.

The table shows their results.

Calculate the percentage reduction in the risk of developing type II diabetes in group C compared with group A. Use only the people who completed the 3 years. Give your answer to 3 significant figures.

Suggest why the scientists gave group A a leaflet of advice rather than no advice at all.

Explain why the scientists divided the people into the groups at random.

A spokesperson for a company that makes sugary snacks said: 'This study shows that exercise is what prevents type II diabetes, so people do not need to eat fewer sugary snacks.' Evaluate this statement.

Table with columns "Group", "Number who started", "Number who completed 3 years", "Number of these who developed type II diabetes", "Mean change in body mass / kg". Group: A; Number who started: 100; Number who completed 3 years: 94; Number of these who developed type II diabetes: 26; Mean change in body mass / kg: -0.3 | Group: B; Number who started: 100; Number who completed 3 years: 90; Number of these who developed type II diabetes: 18; Mean change in body mass / kg: -1.6 | Group: C; Number who started: 100; Number who completed 3 years: 86; Number of these who developed type II diabetes: 9; Mean change in body mass / kg: -4.8.

Model answer

Risk in group A = 26 ÷ 94 = 0.2766 (27.7%)
Risk in group C = 9 ÷ 86 = 0.1047 (10.5%)
Percentage reduction = (0.2766 - 0.1047) ÷ 0.2766 × 100 = 62.2%

It would be unethical to give people at risk of type II diabetes no advice at all; group A also shows the effect of the usual advice, so the other groups show the extra effect of the programme.

Random allocation means that the groups are likely to be similar in other factors that affect the risk of diabetes, such as age, body mass and genes, and it stops the scientists choosing who goes into each group.

The data partly support the statement: exercise alone reduced the risk from 27.7% in group A to 20.0% in group B, and the groups were large and randomly allocated. However, group C, which also reduced its energy intake, had a risk of only 10.5%, about half that of group B, so diet also matters. The diet reduced total energy intake rather than sugary snacks in particular, so the study cannot show that eating sugary snacks has no effect. The spokesperson may also be biased, because the company sells sugary snacks.

Explanation

Giving the comparison group the usual advice is both ethical and a fair baseline. Risk = number of people affected ÷ number of people in the group, so use the people who completed the study for both groups; then percentage reduction = (risk A - risk C) ÷ risk A × 100. When evaluating a claim, use the data for and against it, check what was actually tested (here total energy intake, not sugar) and consider who is making the claim. Random allocation spreads other risk factors evenly between the groups.

Mark scheme
  1. 1 mark

    Correct method: risks of 26 ÷ 94 (0.277) for group A and 9 ÷ 86 (0.105) for group C, then (0.277 - 0.105) ÷ 0.277 × 100; or a correct final answer of 62.2 with no working

    Max 8. A correct answer of 62.2% (accept 62.1) with no working scores 2 marks (points 1 and 2). Accept for 1 mark: 65.4 ((26 - 9) ÷ 26 × 100, the numbers who completed not used) OR 64.3 (risks rounded to 28% and 10% before the subtraction) OR 0.622 (not multiplied by 100) OR 37.8 (the risk in C as a percentage of the risk in A) OR 62 (not given to 3 significant figures).

  2. 1 mark

    62.2 (%)

    Accept 62.1.

  3. 1 mark

    It would be unethical to give people at risk of type II diabetes no advice or help

    Points 3 and 4: max 1. Insufficient: 'to make it fair'.

  4. 1 mark

    Group A shows the effect of the usual advice, so the comparison shows the extra effect of the exercise programme (and diet) / all the groups received some attention from the scientists

  5. 1 mark

    So that the groups are similar in other factors that affect the risk, e.g. age / body mass / diet / genes OR to avoid bias in choosing who goes into each group

    Insufficient: 'to make it fair' alone. Reject 'to control variables' with no idea of the groups being similar.

  6. 1 mark

    (For) exercise alone reduced the risk: 20.0% in group B compared with 27.7% in group A

    Points 6 to 12: max 4, with at most 2 marks from points 6 and 7 (for the statement) and at most 3 marks from points 8 to 12 (against it). Accept the risks to 2 significant figures, or a comparison of the numbers 18 and 26 if the similar group sizes are noted.

  7. 1 mark

    (For) the groups were large (100 people each) and randomly allocated, so the difference between groups A and B is likely to be caused by the exercise

  8. 1 mark

    (Against) group C, which exercised and also reduced its energy intake, had a much lower risk (10.5%) than group B (20.0%), so diet also affects the risk

    Accept 'the risk in group C was about half that in group B'. Accept a comparison of the numbers 9 and 18 if the similar group sizes are noted.

  9. 1 mark

    (Against) the diet reduced total energy intake, not sugary snacks in particular, so the study does not test the effect of sugary snacks / cannot show that eating them has no effect

  10. 1 mark

    (Against) the spokesperson may be biased / has a conflict of interest, because the company sells sugary snacks

  11. 1 mark

    (Against) the people who left the study (6, 10 and 14) were not included and may differ from those who stayed

  12. 1 mark

    (Against) only people with prediabetes were studied, so the results may not apply to other people

Ready to try the rest? Every answer you write is marked against the mark scheme, so you can see exactly where the marks are.

Study Helper Hints first, answers after you try

Stuck on this one? Ask for a hint and I’ll point you in the right direction, without giving the answer away. Once you’ve checked your answer, I’ll show you how the marks are awarded.
