Question 1
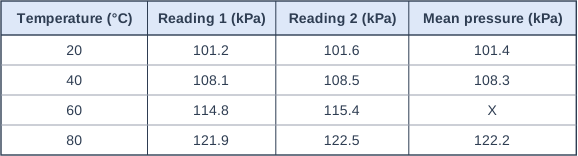
1 markA student measures the pressure of the air in a sealed, rigid flask at different temperatures from 0 °C to 100 °C. She plots a graph of pressure (on the y-axis) against temperature (on the x-axis).
Which describes the shape of her graph?
Choose your answer.
- A a curve that rises and then falls
- B a horizontal straight line
- C a straight line that slopes downwards
- D a straight line that slopes upwards
Model answer
D (a straight line that slopes upwards)
Explanation
When the air in a rigid, sealed flask is heated, its molecules move faster, so they hit the walls more often and harder, and the pressure rises. The pressure goes up by about the same amount for each degree, so the graph is a straight line sloping upwards. It does not pass through the origin, because the air still has a pressure at 0 °C.
Mark scheme
-
1 mark
D / a straight line that slopes upwards
The only correct answer is D: at constant volume, the pressure of a fixed mass of gas increases steadily as its temperature increases. A is not correct because the pressure never starts to fall while the temperature is still rising. B is not correct because a horizontal line would mean the pressure does not change with temperature. C is not correct because a line sloping downwards would mean the pressure decreases as the temperature increases. ALLOW the letter or the option. If more than one option is given, do not award the mark.