
Level:
Correct: 0
Incorrect: 0
Marks: 0/0
Exam Practice
Course:
Topics:
Avg
score:
–
Topics
done:
0/24

Reaction times and stopping distances

Practise 17 exam-style questions on Reaction times and stopping distances for Edexcel GCSE Combined Science (Foundation Physics Paper 1). Write your answer as you would in the exam and get it marked in seconds against the mark scheme, point by point, with the Study Helper on hand if you get stuck.

  • 17 questions
  • 1–6 marks each
  • Instant marking
  • No sign-up needed
17 questions, marked as you go

Sample questions with model answers

Here are 4 of the questions in this topic, each with a model answer, an explanation of why it earns the marks and the mark scheme an examiner would use.

Question 1

1 mark

Which of these changes would reduce a car's braking distance?

Choose your answer.

  • A carrying four passengers instead of one
  • B replacing worn tyres with new tyres
  • C driving on a road covered in wet leaves
  • D driving at a higher speed

Model answer

B - replacing worn tyres with new tyres.

Explanation

The braking distance depends on the speed and mass of the car, the state of its brakes and tyres, and the road surface. New tyres give more friction between the tyres and the road, so the car can decelerate more. Each of the other changes makes the braking distance longer.

Mark scheme
  1. 1 mark

    B / replacing worn tyres with new tyres

    The only correct answer is B: new tyres with deep tread grip the road better, so there is more friction between the tyres and the road, a bigger braking force can act and the car stops in a shorter distance. A is not correct because extra passengers increase the mass, so the car decelerates less with the same braking force and the braking distance increases; C is not correct because wet leaves reduce the friction between the tyres and the road, which increases the braking distance; D is not correct because a faster car has more speed to lose, so its braking distance is longer. Accept the letter or the option. If more than one option is given, do not award the mark.
Question 2

2 marks

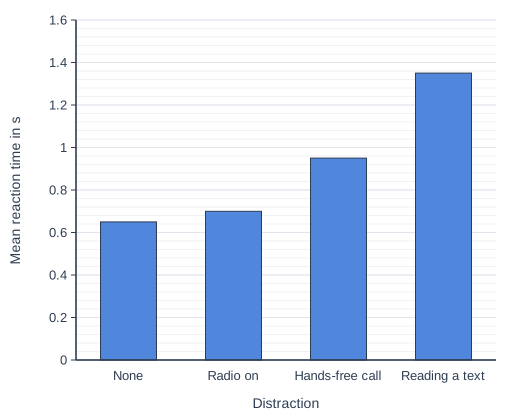
Scientists measured the reaction times of a group of volunteers in a driving simulator. Each volunteer braked as soon as a hazard appeared on the screen. The test was repeated with different distractions.

The bar chart shows the mean reaction time for each condition.

Describe what the bar chart shows about the effect of distractions on reaction time.

Bar chart of mean reaction time in s for each distraction: None 0.65, Radio on 0.7, Hands-free call 0.95, Reading a text 1.35.

Model answer

All three distractions increase the reaction time compared with no distraction (0.65 s). Listening to the radio has the smallest effect (0.70 s), a hands-free call has a bigger effect (0.95 s) and reading a text has the biggest effect: it roughly doubles the reaction time, to 1.35 s.

Explanation

Describe the overall pattern first, then compare the sizes of the effects, quoting values from the chart. Distractions take the driver's attention away from the road, so it takes longer to notice a hazard and react; reading a text is the worst because the driver is not even looking at the road.

Mark scheme
  1. 1 mark

    every distraction increases the (mean) reaction time (compared with no distraction)

    Any two from MP1 to MP3; max 2. accept 'the reaction time is shortest with no distraction'.

  2. 1 mark

    reading a text increases the reaction time the most / (roughly) doubles it (from 0.65 s to 1.35 s)

    accept 'reading a text has the biggest effect'.

  3. 1 mark

    listening to the radio has the smallest effect (0.65 s to 0.70 s) / a hands-free call increases the reaction time more than the radio (0.95 s)

    accept a correct comparison of any two distractions using values from the chart.

Question 3

3 marks

A road safety officer studies dashcam video of a car approaching a pedestrian crossing. The speed limit on the road is 30 mph, which is 13.4 m/s.

The video shows that the car travelled 12 m during the driver's reaction time of 0.75 s, before the brakes were applied.

Calculate the speed of the car.

Then calculate how far the car would have travelled during the same reaction time if it had been travelling at the speed limit.

Model answer

distance = speed × time, so speed = distance ÷ time
speed = 12 ÷ 0.75 = 16 m/s
At the speed limit: distance = speed × time = 13.4 × 0.75 = 10.05 m (about 10 m)
So, because it was going faster than the limit, the car travelled about 2 m further before the brakes were applied.

Explanation

During the reaction time the car is not braking, so it moves at a steady speed: recall distance = speed × time and rearrange it to find the speed. For the second part, multiply the speed limit by the same reaction time. The thinking distance is proportional to the speed, so driving faster than the limit means the car travels further before the brakes are even applied.

Mark scheme
  1. 1 mark

    substitution: (speed =) 12 ÷ 0.75; or a correct final answer of 16 m/s with no working

    An answer of 16 m/s with no working scores marking points 1 and 2; an answer of 10 m (10.05 m) for the second part with no working scores marking point 3, so answers of 16 m/s and 10 m with no working score 3 marks. 12 × 0.75 = 9 (multiplying) and 0.75 ÷ 12 = 0.0625 (dividing the wrong way round) are wrong methods and score 0 for marking points 1 and 2.

  2. 1 mark

    evaluation: (speed =) 16 (m/s); or a correct final answer of 16 m/s with no working

    Ignore units.

  3. 1 mark

    (distance at the speed limit =) 13.4 × 0.75 = 10.05 (m) / 10 (m) / 10.1 (m)

    This mark does not depend on marking points 1 and 2. accept 10, 10.0, 10.05 or 10.1 (m). allow a proportion method, e.g. 12 × 13.4 ÷ 16 = 10.05 (m). 13.4 ÷ 0.75 = 17.9 (dividing) is a wrong method and scores 0. The difference on its own (12 − 10.05 = 1.95 m) does not answer the question and scores 0, but ignore it if the distance of 10.05 m is also given. Ignore units.

Question 4

4 marks

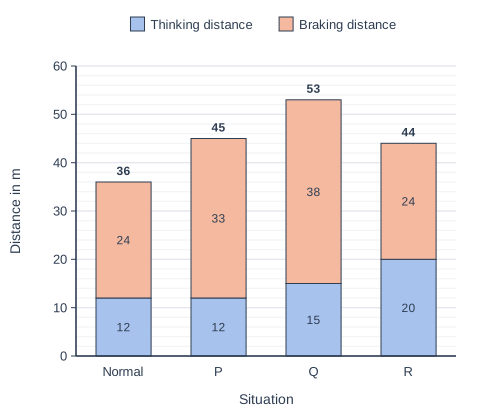
The chart shows the stopping distance of a car on a dry road in four situations.

The 'Normal' bar shows the Highway Code's typical distances for a car travelling at 40 mph. Bars P, Q and R are a road safety group's estimates. Each of them shows the effect of one change from the 'Normal' situation:
- the driver has drunk alcohol
- the car's brakes are badly worn
- the car is travelling at 50 mph instead of 40 mph.

Give the letter of the bar that shows each change.

Explain how the chart shows which bar is for the higher speed.

Stacked bar chart with 4 vertical bars. The value axis (y-axis) is "Distance in m", from 0 to 60 marked every 10; the bars are labelled along the x-axis, "Situation", from left to right. Each bar is split into 2 parts, shown in the key: Thinking distance (bottom, blue) and Braking distance (top, orange). Values: Normal: thinking distance 12 m, braking distance 24 m, total 36 m; P: thinking distance 12 m, braking distance 33 m, total 45 m; Q: thinking distance 15 m, braking distance 38 m, total 53 m; R: thinking distance 20 m, braking distance 24 m, total 44 m. The value of each part is printed on it. Each bar's total is printed above it.

Model answer

R shows the alcohol: only the thinking distance is longer (20 m instead of 12 m), because alcohol makes the driver react more slowly.
P shows the worn brakes: only the braking distance is longer (33 m instead of 24 m), because worn brakes give a smaller braking force.
Q shows the higher speed. Both distances are longer (15 m thinking distance and 38 m braking distance, instead of 12 m and 24 m). At a higher speed the car travels further during the driver's reaction time, and it needs a longer distance to stop once the brakes are applied.

Explanation

Stopping distance = thinking distance + braking distance. Factors that affect the driver, such as alcohol, change the reaction time and so only the thinking distance; factors that affect the car or the road, such as worn brakes, change only the braking distance. Speed is the one factor that increases both. Choosing the bar with the longest total for the higher speed, without looking at the two parts of each bar, is a common mistake.

Mark scheme
  1. 1 mark

    R: the driver has drunk alcohol

    Mark the three letters independently. If the same letter is given for two different changes, award neither of those marks.

  2. 1 mark

    P: the car's brakes are badly worn

  3. 1 mark

    Q: the car is travelling at 50 mph

  4. 1 mark

    (Q, because) both the thinking distance and the braking distance are longer (15 m and 38 m instead of 12 m and 24 m), while alcohol and worn brakes each change only one of the distances

    This mark depends on Q being given for the higher speed. The idea that BOTH distances increase is needed; accept a reason for each, e.g. 'the faster car travels further during the reaction time and needs a longer distance to stop once it brakes'. Do not accept 'Q has the longest stopping distance' on its own (the totals alone do not show which change was made).

Ready to try the rest? Every answer you write is marked against the mark scheme, so you can see exactly where the marks are.

Study Helper Hints first, answers after you try

Stuck on this one? Ask for a hint and I’ll point you in the right direction, without giving the answer away. Once you’ve checked your answer, I’ll show you how the marks are awarded.