Level:
Correct: 0
Incorrect: 0
Marks: 0/0
Exam Practice
Course:
Topics:
AQA GCSE Economics (Paper 1) Smart practice A mixed round aimed at your weak spots
Unit 1
Economic foundations
Economic activity
Economic activity
The factors of production
Unit 2
Resource allocation
Markets and allocation of resources
Markets and the allocation of resources
Economic sectors
Economic sectors
Specialisation, division of labour, and exchange
Specialisation, division of labour and exchange
Unit 3
How prices are determined
Demand for goods and services
Supply for goods and services
Supply of goods and services
Equilibrium price
Equilibrium price
Intermarket relationships
Price elasticity of demand
Price elasticity of supply
Unit 4
Production, costs, revenue and profit
The importance of cost, revenue and profit for producers
Cost, revenue and profit for producers
Production and productivity
Economies of scale
Economies of scale
Unit 5
Competitive and concentrated markets
The importance of market structures on producers and consumers
Market structures
Competitive markets
Competitive markets
The labour market
The labour market
Unit 6
Market failure
Avg
score:
–
Topics
done:
0/21

Supply of goods and services

Practise 17 exam-style questions on Supply of goods and services for AQA GCSE Economics (Paper 1). Write your answer as you would in the exam and get it marked in seconds against the mark scheme, point by point, with the Study Helper on hand if you get stuck.

  • 17 questions
  • 1–15 marks each
  • Instant marking
  • No sign-up needed
17 questions, marked as you go

Sample questions with model answers

Here are 4 of the questions in this topic, each with a model answer, an explanation of why it earns the marks and the mark scheme an examiner would use.

Question 1

1 mark

The government introduces a new tax of 20p on every can of energy drink sold, which the producers must pay.

What is the effect on the market for energy drinks?

Choose your answer.

  • A There is an extension of supply: a movement up along the supply curve.
  • B The supply curve shifts to the right.
  • C The demand curve shifts to the left.
  • D The supply curve shifts to the left.

Model answer

D The supply curve shifts to the left.

Explanation

A tax paid by producers adds to the cost of supplying each can, so producers are willing to supply less at every price: the supply curve shifts to the left (upwards by the amount of the tax). It is not a movement along the curve, because the tax is a non-price factor. The tax does not directly change consumers' demand.

Mark scheme
  1. 1 mark

    D / The supply curve shifts to the left.

    Accept the letter or the option text. If more than one option is given, 0 marks.

Question 2

2 marks

State two factors that could cause a decrease in the supply of milk from UK dairy farms.

Model answer

1. A rise in the cost of animal feed.
2. A disease outbreak among dairy cattle.

Explanation

A decrease in supply means less is supplied at every price, so the supply curve shifts to the left; any factor that raises costs or reduces farms' ability to produce will do this. A fall in the price of milk is a common wrong answer: it reduces the quantity supplied (a movement along the curve) but does not shift the supply curve.

Mark scheme
  1. 2 marks

    Any two different factors that would decrease supply, e.g. a rise in the cost of animal feed / fertiliser / fuel / energy / a rise in wages or a shortage of farm workers / disease among dairy cattle / bad weather or drought reducing grass for grazing / new regulations, e.g. stricter environmental rules / a new tax on producers or the removal of a subsidy / farmers leaving the industry (fewer dairy farms) / a rise in the price of other products the farm could produce instead, e.g. beef or crops

    1 mark for each different correct factor, max 2. Accept the factor named without a direction (e.g. 'costs of feed', 'the weather'), but if a direction is given it must decrease supply ('a fall in feed prices' scores 0). Do not accept a fall in the price of milk (that causes a movement along the supply curve, a contraction, not a decrease in supply) or a fall in demand for milk. 'Higher costs' and 'more expensive feed' given as two answers score 1 mark. This indicative content is not exhaustive: credit any other valid point.

Question 3

2 marks

The government decides to pay UK manufacturers of electric buses a subsidy for each bus they produce.

Explain one reason why this is likely to increase the supply of electric buses.

Model answer

The subsidy lowers the cost to the manufacturer of producing each electric bus, so making buses becomes more profitable at any given price. Manufacturers are therefore willing and able to supply more buses at every price, so the supply curve shifts to the right.

Explanation

A subsidy to producers works like a fall in costs: it raises the profit made on each unit at every price, so supply increases and the curve shifts to the right (downwards by the amount of the subsidy). The second mark needs this link to supply. Saying that more buses will be bought describes the outcome in the market, not why supply changes.

Mark scheme
  1. 1 mark

    Identifies a valid reason, e.g. the subsidy reduces the cost of producing each bus / adds to what the manufacturer receives for each bus / makes producing electric buses more profitable / may attract new firms into the market

    1 mark for a reason identified. This indicative content is not exhaustive: credit any other valid point.

  2. 1 mark

    Explains it: links it to supply, e.g. so manufacturers are willing and able to supply more buses at every price and the supply curve shifts to the right (downwards by the amount of the subsidy)

    2 marks = reason explained; 1 mark = reason identified; 0 = nothing worthy of credit. Do not credit answers that describe a movement along the supply curve, or that say bus companies will demand more buses (demand).

Question 4

6 marks

Poor harvests in several of the world's main orange-growing regions, caused by bad weather and a disease that damages orange trees, have pushed up the world price of oranges.

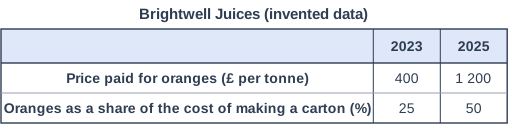
Figure 1 shows data for Brightwell Juices, a UK maker of orange juice (invented data).

Using Figure 1, analyse the possible effects of the rise in the price of oranges on the supply of orange juice by firms such as Brightwell Juices.

Brightwell Juices (invented data). Table with columns (row headings), "2023", "2025". Price paid for oranges (£ per tonne); 2023: 400; 2025: 1 200 | Oranges as a share of the cost of making a carton (%); 2023: 25; 2025: 50.

Model answer

Oranges are the main raw material in orange juice, so a rise in their price raises the cost of producing every carton. Figure 1 shows that the price Brightwell Juices paid for oranges tripled from £400 to £1 200 a tonne, and oranges rose from 25% to 50% of the cost of making a carton. If its other costs did not change, this means each carton costs about 50% more to make.

With higher costs, each carton is less profitable at any given price, so juice makers are willing to supply fewer cartons at every price. The supply curve of orange juice shifts to the left: this is a decrease in supply, not a movement along the curve, because the cause is a cost of production, not the price of orange juice itself.

Some firms may respond by changing what they supply. They might sell smaller cartons, make juice drinks that contain less orange, or switch some production to blends with cheaper fruit such as apple, so the supply of pure orange juice falls further. Smaller juice makers with thin profit margins may not be able to cover their costs at all and could leave the market, reducing market supply again.

The effect may not be immediate. Firms that agreed contracts with growers or bought orange concentrate months in advance may keep supplying at first and cut back only when their cheaper stocks run out. The bigger the share of costs that oranges make up, the larger the leftward shift in supply will be, and Brightwell's figures show that this share has doubled.

Explanation

Top answers use the figure (the price paid tripled; oranges' share of costs rose from 25% to 50%) and build a chain: higher input costs, lower profit per carton at each price, less supplied at every price, a leftward shift of supply. Further development such as smaller cartons, cheaper blends, firms leaving the market, or stocks bought in advance reaches Level 3. Treating the change as a movement along the supply curve is a serious error.

Mark scheme
  1. 6 marks

    Levels of response (6 marks).
    Level 3 (5-6 marks): A full analysis of the economic evidence, a well-developed and logical chain of reasoning.
    Level 2 (3-4 marks): An incomplete analysis of the economic evidence, starts to develop a chain of reasoning. Good application of knowledge and understanding of concepts/issues mostly relevant to the context.
    Level 1 (1-2 marks): Analysis of discrete points of the economic evidence with no chain of reasoning attempted. Basic application of knowledge and understanding of concepts/issues with limited relevance to the context.
    0 marks: Nothing written worthy of credit.

    Max 4 if the answer makes no use of the evidence or context given. Levels are a ladder, as AQA instructs: an answer reaches Level 3 only if it also applies knowledge to the context, as Level 2 requires. Indicative content (not exhaustive; credit other valid points): Use of the evidence: the price Brightwell paid for oranges tripled from £400 to £1 200 a tonne (a rise of 200%); oranges rose from 25% to 50% of the cost of making a carton, which (if other costs were unchanged) means the cost of making a carton rose by about 50%. Possible chains of reasoning: oranges are the main raw material, so the cost of producing each carton rises; at every price each carton is less profitable, so firms are willing to supply fewer cartons and the supply curve of orange juice shifts to the left (a decrease in supply, not a movement along the curve); smaller or less profitable juice makers may leave the market, reducing market supply further; firms may change their products, e.g. smaller cartons, juice drinks with less orange, or blends with cheaper fruit such as apple, so the supply of pure orange juice falls; a lower supply is likely to lead to a higher price of orange juice; firms that had agreed contracts or bought oranges or concentrate in advance at older, lower prices may cut supply only later; the size of the effect depends on how large a share of costs oranges make up (Brightwell's figures show it has doubled). An answer that says the rise in the price of oranges causes an extension of supply cannot go above Level 1.

Ready to try the rest? Every answer you write is marked against the mark scheme, so you can see exactly where the marks are.

Study Helper Hints first, answers after you try

Stuck on this one? Ask for a hint and I’ll point you in the right direction, without giving the answer away. Once you’ve checked your answer, I’ll show you how the marks are awarded.