Level:
Correct: 0
Incorrect: 0
Marks: 0/0
Exam Practice
Course:
Topics:
AQA GCSE Economics (Paper 1) Smart practice A mixed round aimed at your weak spots
Unit 1
Economic foundations
Economic activity
Economic activity
The factors of production
Unit 2
Resource allocation
Markets and allocation of resources
Markets and the allocation of resources
Economic sectors
Economic sectors
Specialisation, division of labour, and exchange
Specialisation, division of labour and exchange
Unit 3
How prices are determined
Demand for goods and services
Supply for goods and services
Supply of goods and services
Equilibrium price
Equilibrium price
Intermarket relationships
Price elasticity of demand
Price elasticity of supply
Unit 4
Production, costs, revenue and profit
The importance of cost, revenue and profit for producers
Cost, revenue and profit for producers
Production and productivity
Economies of scale
Economies of scale
Unit 5
Competitive and concentrated markets
The importance of market structures on producers and consumers
Market structures
Competitive markets
Competitive markets
The labour market
The labour market
Unit 6
Market failure
Avg
score:
–
Topics
done:
0/21

Intermarket relationships

Practise 15 exam-style questions on Intermarket relationships for AQA GCSE Economics (Paper 1). Write your answer as you would in the exam and get it marked in seconds against the mark scheme, point by point, with the Study Helper on hand if you get stuck.

  • 15 questions
  • 1–15 marks each
  • Instant marking
  • No sign-up needed
15 questions, marked as you go

Sample questions with model answers

Here are 4 of the questions in this topic, each with a model answer, an explanation of why it earns the marks and the mark scheme an examiner would use.

Question 1

1 mark

Tea and coffee are substitutes. The price of coffee rises sharply, and nothing else changes.

What is the most likely effect on the market for tea?

Choose your answer.

  • A The demand curve for tea shifts to the left.
  • B The supply curve for tea shifts to the right.
  • C There is a movement along the demand curve for tea.
  • D The demand curve for tea shifts to the right.

Model answer

D The demand curve for tea shifts to the right.

Explanation

When coffee becomes dearer, some consumers switch to its substitute, tea, so more tea is demanded at every price: the demand curve for tea shifts to the right. The price of tea itself has not changed, so this is a shift, not a movement along the curve. Nothing has happened to the costs of producing tea, so its supply is unchanged.

Mark scheme
  1. 1 mark

    D / The demand curve for tea shifts to the right.

    Accept the letter or the option text. If more than one option is given, 0 marks.

Question 2

2 marks

Explain one reason why a rise in the price of butter is likely to increase the demand for margarine.

Model answer

Butter and margarine are substitutes because both can be used as a spread or for cooking. When butter becomes more expensive, some consumers switch to margarine instead, so more margarine is demanded at every price and its demand curve shifts to the right.

Explanation

The first mark is for recognising that the goods are substitutes, the second for the chain: consumers switch, and demand for margarine shifts to the right. The price of margarine has not changed, so this is a shift of its demand curve, not a movement along it.

Mark scheme
  1. 1 mark

    Identifies that butter and margarine are substitutes / can be used instead of each other (as spreads or for cooking)

    1 mark for the relationship identified. This indicative content is not exhaustive: credit any other valid point.

  2. 1 mark

    Explains it: consumers switch from the dearer butter to margarine, so more margarine is demanded at every price / the demand curve for margarine shifts to the right

    2 marks = reason explained; 1 mark = reason identified; 0 = nothing worthy of credit. Do not accept answers that say the price of margarine falls.

Question 3

3 marks

A theme park sells 8 000 entry tickets a week. On average, 45% of visitors also buy a photo of themselves on a ride, at £12 each.

The park cuts its entry price, and ticket sales rise to 9 600 a week. The same percentage of visitors buy a photo, and its price does not change.

Calculate the increase in the theme park's weekly revenue from ride photos.

Model answer

Photos sold before = 8 000 × 0.45 = 3 600
Photos sold after = 9 600 × 0.45 = 4 320
Increase in photos = 720
Increase in revenue = 720 × £12 = £8 640 a week

Explanation

Entry tickets and ride photos are complements: cheaper tickets bring more visitors, which raises the demand for photos. Work out the number of photos at each level of visitors, then multiply the increase by the price. Forgetting that only 45% of visitors buy a photo gives £19 200, which is far too high.

Mark scheme
  1. 1 mark

    Finds the number of photos sold before or after (3 600 or 4 320), or the increase in photos sold (720); or a correct final answer of £8 640 with no working

    An answer of £8 640 with no working scores 3 marks.

  2. 1 mark

    Correct method for the change in revenue, e.g. 720 × £12 / (4 320 × £12) - (3 600 × £12) = £51 840 - £43 200

    Allow follow-through from a wrong number of photos. Ignoring the 45% (1 600 × £12 = £19 200) scores 1 mark for this method point only.

  3. 1 mark

    £8 640

    Accept 8640 or 8 640 with or without the £ sign.

Question 4

9 marks

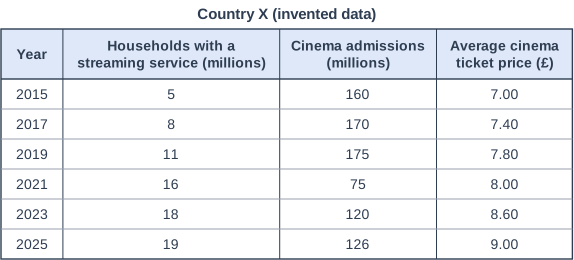
Figure 1 - Streaming and cinema in Country X

In Country X, more and more households pay for video streaming services, which offer thousands of films and series at home for a monthly fee. Some people argue that streaming is a substitute for going to the cinema. Others say a trip to the cinema is a different experience: a night out, with a big screen and new films that are often not available to stream until months later. Cinemas were closed for several months in 2021. Figure 1 shows data for Country X (invented data).

Using Figure 1, assess whether streaming services and cinema trips are close substitutes.

Country X (invented data). Table with columns "Year", "Households with a streaming service (millions)", "Cinema admissions (millions)", "Average cinema ticket price (£)". Year: 2015; Households with a streaming service (millions): 5; Cinema admissions (millions): 160; Average cinema ticket price (£): 7.00 | Year: 2017; Households with a streaming service (millions): 8; Cinema admissions (millions): 170; Average cinema ticket price (£): 7.40 | Year: 2019; Households with a streaming service (millions): 11; Cinema admissions (millions): 175; Average cinema ticket price (£): 7.80 | Year: 2021; Households with a streaming service (millions): 16; Cinema admissions (millions): 75; Average cinema ticket price (£): 8.00 | Year: 2023; Households with a streaming service (millions): 18; Cinema admissions (millions): 120; Average cinema ticket price (£): 8.60 | Year: 2025; Households with a streaming service (millions): 19; Cinema admissions (millions): 126; Average cinema ticket price (£): 9.00.

Model answer

Substitutes are goods or services that can be used instead of each other, so if streaming and cinema trips are close substitutes, the growth of streaming should reduce the demand for cinema trips. Some of the data support this. Since 2019 the number of households with streaming has risen from 11 million to 19 million (72.7%), but cinema admissions in 2025 were still only 126 million, 28% below the 175 million of 2019. This suggests that some people who used to go to the cinema now watch films at home instead. Streaming is also much cheaper per film for a family than several cinema tickets, and if films become available to stream soon after release, more people will wait.

However, the earlier data suggest they are not close substitutes. Between 2015 and 2019 the number of streaming households more than doubled, from 5 million to 11 million, yet cinema admissions rose from 160 million to 175 million. If they were close substitutes, admissions should have fallen. A cinema trip offers something streaming cannot: a night out, a big screen and new films that cannot yet be streamed. Streaming may even work as a complement, as series and trailers build interest in films that people then go to see.

The fall in admissions after 2019 may also have other causes. Cinemas were closed for months in 2021, which broke people's habits, and the average ticket price rose from £7.80 to £9.00, an increase of 15.4%. A higher ticket price reduces the quantity of cinema trips demanded, a movement along the demand curve that has nothing to do with streaming. Admissions are also recovering, rising 5% from 120 million in 2023 to 126 million in 2025.

Overall, I think streaming and cinema trips are only partial substitutes, not close ones. The years before 2020 show that cinema demand can grow alongside streaming, and the later fall can be explained partly by the closures and higher prices. They are closer substitutes for some consumers, such as families watching smaller films, than for others, such as young people going out to see big new releases. How close they are depends mainly on how soon films can be streamed after release and on the price of cinema tickets compared with a streaming subscription.

Explanation

Level 3 answers apply the meaning of substitutes and test it against the data: streaming more than doubled while admissions rose before 2020, but admissions stayed well below 2019 after the closures. They weigh other explanations (closures, a 15.4% rise in ticket prices, a movement along the demand curve) and reach a judgement that says it depends on the consumer, the type of film or the release window. Simply asserting that streaming 'killed the cinema' ignores the evidence.

Mark scheme
  1. 9 marks

    Levels of response (9 marks).
    Level 3 (7-9 marks): A fully justified conclusion with sustained evaluation, which is coherent and relevant, with judgements supported by evidence. A full analysis of the economic evidence, a well-developed and logical chain of reasoning. Comprehensive application of knowledge and understanding of pertinent concepts/issues relevant to the context; specialist language used throughout.
    Level 2 (4-6 marks): A partially justified conclusion with an evaluation, which is mostly coherent and relevant; judgements may not be fully supported by evidence. An incomplete analysis of the economic evidence; starts to develop a chain of reasoning. Good application of knowledge and understanding of concepts/issues mostly relevant to the context; specialist language used mostly appropriately.
    Level 1 (1-3 marks): A basic conclusion or assertion may be present based on evaluative judgements supported by little or no evidence. Analysis of discrete points of the economic evidence with no chain of reasoning attempted. Basic application of knowledge and understanding of concepts/issues with limited relevance to the context; may use non-specialist language.
    0 marks: Nothing written worthy of credit.

    Max 6 if the answer considers only one side or gives no judgement. Max 6 if the answer makes no use of the figure/data given. Indicative content. Evidence that they are close substitutes: both provide films and entertainment for leisure time; after the closures, cinema admissions have not recovered to their 2019 level (126 million in 2025 against 175 million in 2019, 28% lower) while streaming households have kept rising (from 11 million in 2019 to 19 million in 2025, a 72.7% increase), which suggests some people now watch at home instead; streaming is cheaper per film for a family than several cinema tickets; if films are released to stream sooner, more consumers will wait and stream instead. Evidence that they are not close substitutes: between 2015 and 2019 streaming households more than doubled (5 million to 11 million, +120%) yet cinema admissions rose (160 million to 175 million, +9.4%), so the growth of streaming did not reduce cinema demand; a cinema trip is a different experience (a night out, big screen, new releases), and streaming may even act as a complement, as series and trailers build interest in films; the fall in admissions after 2019 has other possible causes: the 2021 closures changed habits, the average ticket price rose from £7.80 to £9.00 (15.4%), which reduces the quantity demanded (a movement along the demand curve), and incomes may have been squeezed; admissions are recovering (120 million in 2023 to 126 million in 2025, +5%). Evaluation: substitutes for some consumers and some films (e.g. families, smaller films) but not others (e.g. big new releases, young people going out); the data show correlation, not cause; data are invented and for one country. Overall: a judgement, e.g. they are partial rather than close substitutes: weak before 2020 and somewhat stronger since, depending on the type of film, the time between cinema and streaming release, and ticket prices.

Ready to try the rest? Every answer you write is marked against the mark scheme, so you can see exactly where the marks are.

Study Helper Hints first, answers after you try

Stuck on this one? Ask for a hint and I’ll point you in the right direction, without giving the answer away. Once you’ve checked your answer, I’ll show you how the marks are awarded.