Level:
Correct: 0
Incorrect: 0
Marks: 0/0
Exam Practice
Course:
Topics:
AQA GCSE Economics (Paper 1) Smart practice A mixed round aimed at your weak spots
Unit 1
Economic foundations
Economic activity
Economic activity
The factors of production
Unit 2
Resource allocation
Markets and allocation of resources
Markets and the allocation of resources
Economic sectors
Economic sectors
Specialisation, division of labour, and exchange
Specialisation, division of labour and exchange
Unit 3
How prices are determined
Demand for goods and services
Supply for goods and services
Supply of goods and services
Equilibrium price
Equilibrium price
Intermarket relationships
Price elasticity of demand
Price elasticity of supply
Unit 4
Production, costs, revenue and profit
The importance of cost, revenue and profit for producers
Cost, revenue and profit for producers
Production and productivity
Economies of scale
Economies of scale
Unit 5
Competitive and concentrated markets
The importance of market structures on producers and consumers
Market structures
Competitive markets
Competitive markets
The labour market
The labour market
Unit 6
Market failure
Avg
score:
–
Topics
done:
0/21

Market failure and misallocation of resources

Practise 14 exam-style questions on Market failure and misallocation of resources for AQA GCSE Economics (Paper 1). Write your answer as you would in the exam and get it marked in seconds against the mark scheme, point by point, with the Study Helper on hand if you get stuck.

  • 14 questions
  • 1–15 marks each
  • Instant marking
  • No sign-up needed
14 questions, marked as you go

Sample questions with model answers

Here are 4 of the questions in this topic, each with a model answer, an explanation of why it earns the marks and the mark scheme an examiner would use.

Question 1

1 mark

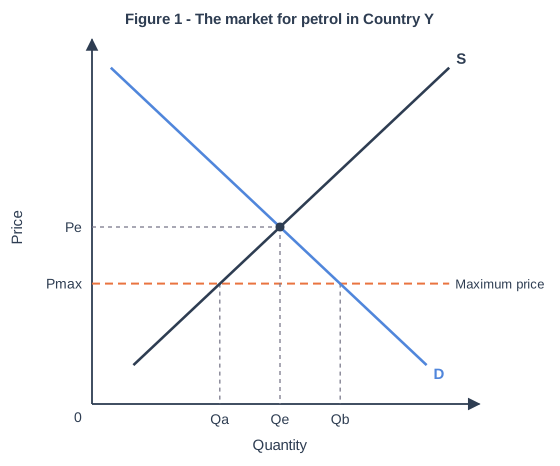
Figure 1 shows the market for petrol in Country Y. The government sets a maximum price for petrol, shown as Pmax.

What does the distance from Qa to Qb show?

Choose your answer.

  • A Excess demand (a shortage) at the maximum price
  • B Excess supply (a surplus) at the maximum price
  • C The increase in demand caused by the maximum price
  • D The increase in supply caused by the maximum price
Figure 1 - The market for petrol in Country Y. A supply and demand diagram with price on the vertical axis and quantity on the horizontal axis (no values are shown). D is a demand curve that slopes downwards from left to right. S is a supply curve that slopes upwards from left to right. D and S cross at price Pe and quantity Qe (dashed lines to the axes). A horizontal dashed line labelled "Maximum price" (marked Pmax on the vertical axis) is drawn across the diagram (below Pe, where D and S cross). It meets S at quantity Qa and D at quantity Qb; Qb is greater than Qa.

Model answer

A Excess demand (a shortage) at the maximum price

At Pmax, which is below the equilibrium price Pe, firms are willing to supply only Qa, but consumers want to buy Qb. Quantity demanded is greater than quantity supplied, so there is a shortage of Qb - Qa.

Explanation

A maximum price set below the equilibrium price leads to excess demand: quantity demanded rises along the demand curve and quantity supplied falls along the supply curve. The price change causes movements along the curves, not shifts, so options C and D are wrong. Excess supply happens with a minimum price set above equilibrium.

Mark scheme
  1. 1 mark

    A / Excess demand (a shortage) at the maximum price

    accept the letter or the option text. If more than one option is given, 0 marks.

Question 2

2 marks

State two methods of government intervention that can be used to counter a misallocation of resources.

Model answer

1. A tax on goods that are over-consumed, such as sugary drinks.
2. A subsidy for goods that are under-consumed, such as public transport.

Explanation

Governments use taxes, subsidies, regulation, state provision, information and maximum or minimum prices to correct a misallocation of resources. Two examples of the same method (two different taxes) earn only one mark.

Mark scheme
  1. 2 marks

    Any two different methods from: taxes (e.g. an indirect tax on a harmful good) / subsidies / regulation or legislation (laws, bans, age limits, quotas) / state (government) provision / providing information (advertising campaigns, labelling, education) / a maximum price / a minimum price / competition policy (investigating or breaking up monopolies, blocking mergers) / tradable pollution permits.

    1 mark for each different correct example, max 2. Do not credit two examples of the same method (e.g. 'a tax on cigarettes' and 'a tax on alcohol', or 'a ban' and 'a law'). Accept 'price controls' as one method (maximum and minimum prices count separately only if both are named). Do not accept vague answers such as 'spend money' or 'help the market'.

Question 3

2 marks

Many bus routes that serve villages make a loss, so bus companies stop running them unless the government pays a subsidy.

Explain one reason why the government might give bus companies a subsidy to run these routes.

Model answer

Without a subsidy, the market would not provide buses on these routes because they make a loss, even though many villagers, especially older people and teenagers without cars, depend on them. The subsidy covers part of the bus company's costs, so the route keeps running and people can still get to work, school, shops and hospital appointments, reducing isolation and inequality.

Explanation

A subsidy is a payment from the government to producers that lowers their costs, so more of a good is supplied. The second mark explains the chain: without it the market under-provides a service with wider benefits; with it the service runs and those benefits (access to work, less isolation, fewer car journeys) are gained.

Mark scheme
  1. 1 mark

    Identifies a valid reason, e.g. without a subsidy the market would under-provide rural buses / people without cars would be cut off / to help people reach jobs, education or healthcare / to reduce car use, congestion and pollution / to reduce inequality or social isolation

    2 marks = reason explained; 1 mark = reason identified; 0 = nothing worthy of credit. This indicative content is not exhaustive: credit any valid reason, not only those listed. Possible answers: without a subsidy the market would under-provide rural buses / people without cars would be cut off / to help people reach jobs, education or healthcare / to reduce car use, congestion and pollution / to reduce inequality or social isolation.

  2. 1 mark

    Explains it: develops the reason with a linked reason or consequence, e.g. the subsidy lowers the firm's costs, so it can run the route without making a loss; this keeps a service that people without cars rely on to get to work, school and hospital, so they are not cut off and can keep working, which a free market would not provide because the route is unprofitable

    Award only if the first mark is awarded. The explanation must say why or how (a linked step), not just repeat or reword the point identified.

Question 4

9 marks

Figure 1 - Renting in Calderbridge

Calderbridge is a city (invented) with a fast-growing population of students and young workers. Average rents have risen much faster than wages, and many young people now spend almost half their take-home pay on rent. The city council wants to set a maximum rent of £900 a month for a one-bedroom flat. Landlords' groups say a cap would lead some landlords to sell their flats or to stop repairing them. Tenants' groups say a cap would stop rents rising beyond what people can afford.

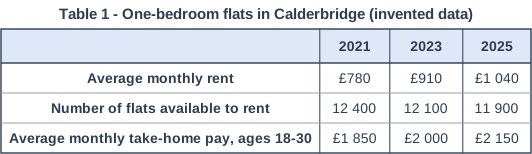
Table 1 shows data about one-bedroom flats in Calderbridge.

Using Figure 1 and Table 1, assess whether a maximum rent of £900 a month would benefit tenants in Calderbridge.

Table 1 - One-bedroom flats in Calderbridge (invented data). Table with columns (row headings), "2021", "2023", "2025". Average monthly rent; 2021: £780; 2023: £910; 2025: £1 040 | Number of flats available to rent; 2021: 12 400; 2023: 12 100; 2025: 11 900 | Average monthly take-home pay, ages 18-30; 2021: £1 850; 2023: £2 000; 2025: £2 150.

Model answer

A maximum rent of £900 a month would bring clear benefits to many tenants. Average rents rose from £780 to £1,040 between 2021 and 2025, a rise of 33.3%, while young people's average take-home pay rose by only 16.2%, from £1,850 to £2,150. Rent therefore rose from about 42% of take-home pay to about 48%. The cap is £140 below the current average rent, about 13.5% lower, which would bring rent back to around 42% of take-home pay. Tenants who already have flats would have more income left for food, travel and saving, which would reduce poverty and inequality among young people in the city.

However, a maximum price set below the equilibrium price creates excess demand. At £900, more people would want to rent their own one-bedroom flat, while fewer flats would be offered, because some landlords would find renting less profitable and sell their flats or use them for something else. The number of flats available to rent is already falling, from 12,400 to 11,900, and a cap could speed this up. The result would be a shortage: long searches, landlords choosing the tenants they prefer, and possibly illegal extra charges paid 'under the table'. Landlords whose income is capped may also stop repairing their flats, so quality falls. Students and young workers moving to the city could find it very hard to get anywhere to live, even though they are the group the policy is meant to help.

Overall, I think a maximum rent would benefit tenants who already have a flat, at least in the short run, but would harm people looking for a flat, so it would not benefit tenants as a whole for long. In the short run the supply of rented flats is quite inelastic, because flats cannot disappear overnight, so the shortage might be small at first, but it would grow as landlords leave the market. Whether the cap benefits tenants overall depends on how far below the equilibrium rent it is, how quickly landlords respond, and whether the council also increases the supply of homes, for example by building more, which would tackle the cause of high rents rather than the symptom.

Explanation

A Level 3 answer uses maximum-price analysis (a cap below equilibrium causes excess demand and a shortage) and the data (rents +33.3% vs pay +16.2%; rent rising from 42% to 48% of pay; fewer flats), weighs gains for existing tenants against losses for new tenants, and reaches a judgement that says what it depends on. Answers that only describe high rents, or ignore the table, are capped at 6 marks.

Mark scheme
  1. 9 marks

    Levels of response (9 marks).
    Level 3 (7-9 marks): A fully justified conclusion with sustained evaluation, which is coherent and relevant, with judgements supported by evidence. A full analysis of the economic evidence, a well-developed and logical chain of reasoning. Comprehensive application of knowledge and understanding of pertinent concepts/issues relevant to the context; specialist language used throughout.
    Level 2 (4-6 marks): A partially justified conclusion with an evaluation, which is mostly coherent and relevant; judgements may not be fully supported by evidence. An incomplete analysis of the economic evidence; starts to develop a chain of reasoning. Good application of knowledge and understanding of concepts/issues mostly relevant to the context; specialist language used mostly appropriately.
    Level 1 (1-3 marks): A basic conclusion or assertion may be present based on evaluative judgements supported by little or no evidence. Analysis of discrete points of the economic evidence with no chain of reasoning attempted. Basic application of knowledge and understanding of concepts/issues with limited relevance to the context; may use non-specialist language.
    0 marks: Nothing written worthy of credit.

    Max 6 if the answer considers only one side or gives no judgement. Max 6 if the answer makes no use of the figure/data given. Indicative content (not exhaustive; credit other valid points). Benefits to tenants: the cap is £140 below the 2025 average rent (£1,040), about 13.5% lower; rents rose 33.3% (£780 to £1,040) while take-home pay rose only 16.2% (£1,850 to £2,150), so rent took 42% of pay in 2021 but 48% in 2025 - at £900 it would be about 42% again; tenants who keep their flats gain more disposable income, less poverty, less inequality; the market is failing young people. Costs to tenants: a maximum price below equilibrium creates excess demand - at a lower rent more people want flats (quantity demanded rises) but fewer flats are offered (quantity supplied falls); the number of flats for rent is already falling (12,400 to 11,900, -4.0%) and a cap could make this faster as landlords sell up; shortage means queues, landlords choosing tenants (discrimination), illegal extra charges (black market 'key money'); lower quality as landlords stop repairs; newcomers to the city (students, young workers) may not find anywhere. Evaluation: the short-run supply of flats is inelastic (flats cannot disappear quickly), so the shortage may be small at first but grow over time; enforcement; whether combined with building more homes. Overall: e.g. benefits existing tenants in the short run but may harm future tenants; depends on how far below equilibrium the cap is, the elasticity of supply of rented flats, and whether the council also increases supply.

Ready to try the rest? Every answer you write is marked against the mark scheme, so you can see exactly where the marks are.

Study Helper Hints first, answers after you try

Stuck on this one? Ask for a hint and I’ll point you in the right direction, without giving the answer away. Once you’ve checked your answer, I’ll show you how the marks are awarded.