Level:
Correct: 0
Incorrect: 0
Marks: 0/0
Exam Practice
Course:
Topics:
AQA GCSE Economics (Paper 1) Smart practice A mixed round aimed at your weak spots
Unit 1
Economic foundations
Economic activity
Economic activity
The factors of production
Unit 2
Resource allocation
Markets and allocation of resources
Markets and the allocation of resources
Economic sectors
Economic sectors
Specialisation, division of labour, and exchange
Specialisation, division of labour and exchange
Unit 3
How prices are determined
Demand for goods and services
Supply for goods and services
Supply of goods and services
Equilibrium price
Equilibrium price
Intermarket relationships
Price elasticity of demand
Price elasticity of supply
Unit 4
Production, costs, revenue and profit
The importance of cost, revenue and profit for producers
Cost, revenue and profit for producers
Production and productivity
Economies of scale
Economies of scale
Unit 5
Competitive and concentrated markets
The importance of market structures on producers and consumers
Market structures
Competitive markets
Competitive markets
The labour market
The labour market
Unit 6
Market failure
Avg
score:
–
Topics
done:
0/21

Demand for goods and services

Practise 18 exam-style questions on Demand for goods and services for AQA GCSE Economics (Paper 1). Write your answer as you would in the exam and get it marked in seconds against the mark scheme, point by point, with the Study Helper on hand if you get stuck.

  • 18 questions
  • 1–15 marks each
  • Instant marking
  • No sign-up needed
18 questions, marked as you go

Sample questions with model answers

Here are 4 of the questions in this topic, each with a model answer, an explanation of why it earns the marks and the mark scheme an examiner would use.

Question 1

1 mark

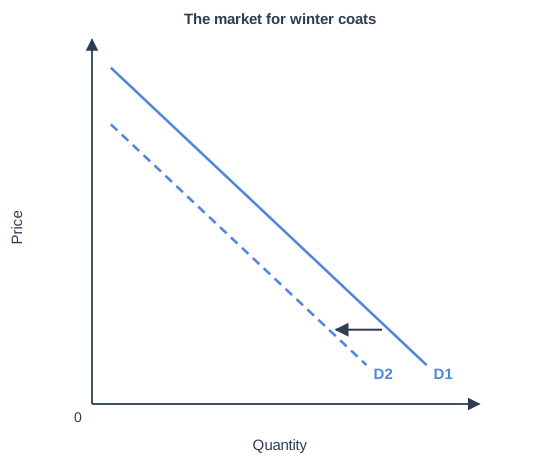
Figure 1 shows a change in the demand for winter coats in the UK.

Which of the following could have caused the shift from D1 to D2?

Choose your answer.

  • A A fall in the price of winter coats
  • B An unusually mild winter
  • C A rise in the cost of the fabric used to make coats
  • D A rise in average incomes in the UK
The market for winter coats. A demand diagram with price on the vertical axis and quantity on the horizontal axis (no values are shown). D1 is a demand curve that slopes downwards from left to right. D2 is a demand curve (dashed) that slopes downwards from left to right, parallel to D1 and to the left of it. An arrow shows a shift from D1 to D2.

Model answer

B An unusually mild winter

Explanation

D2 lies to the left of D1, so fewer coats are demanded at every price: demand has decreased. A mild winter reduces consumers' need for warm coats, a non-price factor that shifts demand to the left. A fall in the coats' own price causes a movement along D1, a rise in fabric costs affects supply, not demand, and higher incomes would shift demand for coats to the right.

Mark scheme
  1. 1 mark

    B / An unusually mild winter

    Accept the letter or the option text. If more than one option is given, 0 marks.

Question 2

2 marks

Explain what is meant by the term 'demand' for a good or service.

Model answer

Demand is the quantity of a good or service that consumers are willing and able to buy at a given price over a given period of time.

Explanation

The key to full marks is 'willing and able': wanting a product is not demand unless the consumer can afford to pay for it (effective demand). Mentioning a price and a time period makes the definition precise. A common error is to give only an example, or to define demand as just 'what people want'.

Mark scheme
  1. 1 mark

    Partial definition: the amount / quantity of a good or service that consumers want / are willing to buy / the desire for a product

    1 mark for the core idea of consumers wanting or being willing to buy. For example 'how much of a product people want to buy' scores 1 mark. An example alone ('people buying more ice cream in summer') or a description of a demand curve is not a definition and scores 0.

  2. 1 mark

    Completes it: consumers must also be able to pay / afford it (willing AND able to buy), at a given price in a given time period

    2 marks for a complete definition, e.g. 'the quantity of a good or service that consumers are willing and able to buy at a given price over a period of time', or 'the desire to buy a product backed by the ability to pay for it'. The words 'at a given price' and 'in a given time period' are good practice but not required for 2 marks; the ability to pay is.

Question 3

2 marks

Explain one reason why a demand curve usually slopes downwards from left to right.

Model answer

When the price of a good falls, it becomes cheaper compared with substitutes, so some consumers switch to it. More consumers are also able to afford it, so the quantity demanded rises as the price falls, which gives a curve sloping downwards from left to right.

Explanation

The demand curve shows an inverse relationship between price and quantity demanded. Full marks need a reason (more people can afford it, it is cheaper than substitutes, income goes further) linked to a higher quantity demanded at a lower price. Simply restating that 'the curve slopes down' earns no credit.

Mark scheme
  1. 1 mark

    Identifies a valid reason, e.g. at a lower price more consumers are able to afford the good / the good becomes cheaper compared with substitutes / consumers' income goes further when the price falls / consumers gain less extra satisfaction from each extra unit, so they buy more only if the price is lower

    1 mark for a reason identified. This indicative content is not exhaustive: credit any other valid point.

  2. 1 mark

    Explains it: links the reason to price and quantity demanded, e.g. so as the price falls the quantity demanded rises (and as the price rises the quantity demanded falls) / so consumers switch from substitutes and buy more of this good at the lower price

    2 marks = reason explained; 1 mark = reason identified; 0 = nothing worthy of credit. A bare statement that 'price and quantity demanded are inversely related' (or 'as price falls, quantity demanded rises') with no reason only restates the question and scores 0.

Question 4

6 marks

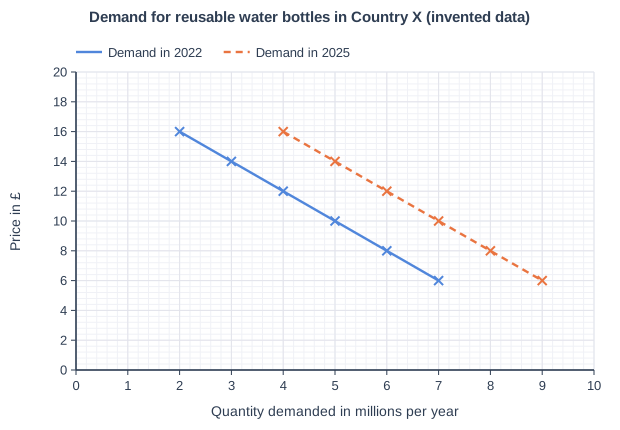
Figure 1 shows the demand for reusable water bottles in Country X in 2022 and in 2025. Over this period the price of a typical bottle stayed at about £10.

Using Figure 1, analyse the possible reasons for the change in the demand for reusable water bottles in Country X.

Demand for reusable water bottles in Country X (invented data). Line graph of price in £ (y-axis, 0 to 20) against quantity demanded in millions per year (x-axis, 0 to 10). "Demand in 2022" joins the points (2, 16), (3, 14), (4, 12), (5, 10), (6, 8), (7, 6). "Demand in 2025" (dashed) joins the points (4, 16), (5, 14), (6, 12), (7, 10), (8, 8), (9, 6).

Model answer

Figure 1 shows that demand increased between 2022 and 2025: the whole demand curve shifted to the right, so about 2 million more bottles a year were demanded at every price. At £10, for example, quantity demanded rose from 5 million to 7 million a year, an increase of 40%. As the price stayed at about £10, this was not a movement along the curve; a non-price factor must have changed.

One likely reason is a change in tastes and preferences. As people became more concerned about plastic waste and the environment, more consumers became willing to buy a reusable bottle at each price. Once this becomes a habit, the higher demand is likely to last.

A second reason is a rise in the price of a substitute. If single-use plastic bottles became more expensive, for example through a charge or a deposit, buying bottled water every day would cost more, so consumers would switch to a reusable bottle instead. This raises demand at every price.

A third reason is the spread of free refill points, which are a complement to reusable bottles: the more places a bottle can be refilled, the more useful it is, so more people are willing to buy one. Advertising and social media may also have made branded bottles fashionable, especially with young people, and rising incomes would allow more consumers to afford a £10 bottle if it is a normal good.

These factors reinforce each other: environmental concern encourages charges on plastic bottles and more refill points, which together explain why the shift was large.

Explanation

Top answers use the figure to show that the curve shifted right (2 million more at every price, 5 million to 7 million at £10) and explain that, with an unchanged price, the cause must be non-price factors. They then build chains of reasoning from each factor to a greater willingness or ability to buy. Saying 'the price fell so demand rose' misreads the figure and confuses a movement with a shift.

Mark scheme
  1. 6 marks

    Levels of response (6 marks).
    Level 3 (5-6 marks): A full analysis of the economic evidence, a well-developed and logical chain of reasoning.
    Level 2 (3-4 marks): An incomplete analysis of the economic evidence, starts to develop a chain of reasoning. Good application of knowledge and understanding of concepts/issues mostly relevant to the context.
    Level 1 (1-2 marks): Analysis of discrete points of the economic evidence with no chain of reasoning attempted. Basic application of knowledge and understanding of concepts/issues with limited relevance to the context.
    0 marks: Nothing written worthy of credit.

    Max 4 if the answer makes no use of the evidence or context given. Levels are a ladder, as AQA instructs: an answer reaches Level 3 only if it also applies knowledge to the context, as Level 2 requires. Indicative content (not exhaustive; credit other valid points): Use of the evidence: the demand curve has shifted to the right: about 2 million more bottles a year are demanded at every price, e.g. at £10 quantity demanded rose from 5 million to 7 million a year (a 40% increase); because the price stayed at about £10, this is a change in demand caused by non-price factors, not a movement along the curve. Possible reasons, each developed into a chain: changing tastes and preferences, e.g. concern about plastic waste and the environment, so more consumers are willing to buy at each price; a rise in the price of a substitute, e.g. a charge or deposit on single-use plastic bottles, so consumers switch to reusable bottles; more free refill points in shops, stations and schools (a complement), making reusable bottles more useful; advertising, branding or celebrity and social-media influence making bottles fashionable; rising incomes, if reusable bottles are a normal good; population growth, or schools and workplaces encouraging staff and students to use them. Credit analysis of how the reasons interact, or of whether the shift is likely to last (a lasting change in tastes compared with a short-lived fashion). An answer that treats the change as a movement along the curve caused by price cannot go above Level 1.

Ready to try the rest? Every answer you write is marked against the mark scheme, so you can see exactly where the marks are.

Study Helper Hints first, answers after you try

Stuck on this one? Ask for a hint and I’ll point you in the right direction, without giving the answer away. Once you’ve checked your answer, I’ll show you how the marks are awarded.