Level:
Correct: 0
Incorrect: 0
Marks: 0/0
Exam Practice
Course:
Topics:
AQA GCSE Economics (Paper 1) Smart practice A mixed round aimed at your weak spots
Unit 1
Economic foundations
Economic activity
Economic activity
The factors of production
Unit 2
Resource allocation
Markets and allocation of resources
Markets and the allocation of resources
Economic sectors
Economic sectors
Specialisation, division of labour, and exchange
Specialisation, division of labour and exchange
Unit 3
How prices are determined
Demand for goods and services
Supply for goods and services
Supply of goods and services
Equilibrium price
Equilibrium price
Intermarket relationships
Price elasticity of demand
Price elasticity of supply
Unit 4
Production, costs, revenue and profit
The importance of cost, revenue and profit for producers
Cost, revenue and profit for producers
Production and productivity
Economies of scale
Economies of scale
Unit 5
Competitive and concentrated markets
The importance of market structures on producers and consumers
Market structures
Competitive markets
Competitive markets
The labour market
The labour market
Unit 6
Market failure
Avg
score:
–
Topics
done:
0/21

Economic sectors

Practise 12 exam-style questions on Economic sectors for AQA GCSE Economics (Paper 1). Write your answer as you would in the exam and get it marked in seconds against the mark scheme, point by point, with the Study Helper on hand if you get stuck.

  • 12 questions
  • 1–9 marks each
  • Instant marking
  • No sign-up needed
12 questions, marked as you go

Sample questions with model answers

Here are 4 of the questions in this topic, each with a model answer, an explanation of why it earns the marks and the mark scheme an examiner would use.

Question 1

1 mark

Which of the following is a service rather than a good?

Choose your answer.

  • A A bicycle
  • B A haircut
  • C A loaf of bread
  • D A laptop

Model answer

B A haircut

Explanation

Goods are physical, tangible products that can be touched, stored and owned, such as a bicycle or a laptop. Services are intangible: they are activities carried out for someone, such as a haircut, a bus journey or a lesson. A business can sell both, for example a bike shop that also repairs bikes.

Mark scheme
  1. 1 mark

    B / A haircut

    accept the letter or the option text; award 0 if more than one option is given. A haircut is an intangible activity done for the customer, so it is a service. A bicycle, a loaf of bread and a laptop are physical (tangible) products, so they are goods.

Question 2

2 marks

Define the term 'tertiary sector'.

Model answer

The tertiary sector is the part of the economy that provides services rather than goods, to consumers and to other businesses, for example banking, retail, transport and health care.

Explanation

The core idea is that the tertiary sector provides services. The second mark is for completing the definition, for example by contrasting services with goods or giving correct examples alongside the core idea. Examples alone do not define the term.

Mark scheme
  1. 1 mark

    The part / sector of the economy that provides services

    2 marks for a complete definition, e.g. 'the sector of the economy that provides services to consumers and other businesses, such as banking, retail and health care, rather than producing goods'. 1 mark for a partial definition, e.g. 'the services sector' or 'businesses that provide services'. 0 marks for examples on their own (e.g. 'banks and shops') or 'the third sector'.

  2. 1 mark

    completes it, e.g. services (intangible) rather than goods; provided to consumers and other businesses; or the core idea supported by correct examples of tertiary industries (retail, banking, transport, health care, education, tourism)

    Awarded only with the first point. Do not award for incorrect examples (e.g. 'manufacturing', 'construction', 'mining').

Question 3

2 marks

A flour mill buys wheat from farmers and grinds it into flour. It sells the flour to a supermarket, which sells it to consumers.

State the economic sector that the flour mill is in, and the economic sector that the supermarket is in.

Model answer

The flour mill is in the secondary sector. The supermarket is in the tertiary sector.

Explanation

The farmers growing wheat are in the primary sector. The mill processes a raw material into a manufactured product, so it is in the secondary sector, and the supermarket provides a retail service, so it is in the tertiary sector. Many products pass through all three sectors on their way to consumers.

Mark scheme
  1. 1 mark

    Flour mill: secondary (sector)

    Accept 'manufacturing' or 'secondary'. Do not accept 'primary' (the farmers are primary).

  2. 1 mark

    Supermarket: tertiary (sector)

    Accept 'tertiary', 'services' or 'retail (tertiary)'. If the two answers are not clearly matched to the mill and the supermarket, award 1 mark at most.

Question 4

6 marks

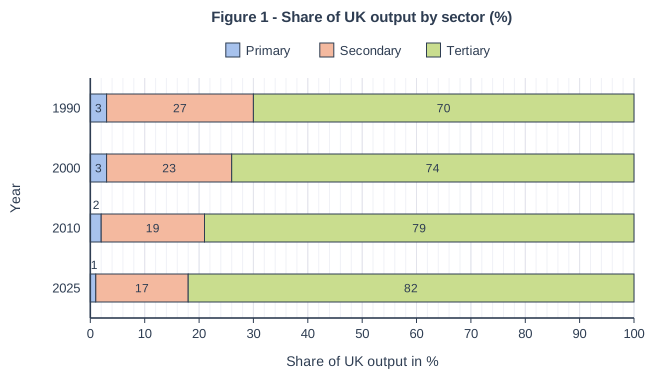
Figure 1 shows the share of the UK's total output (gross value added) produced by each economic sector in 1990, 2000, 2010 and 2025. The figures come from the Office for National Statistics and are rounded to whole numbers.

Using Figure 1, analyse the possible reasons for the changes in the relative size of the UK's economic sectors between 1990 and 2025.

Figure 1 - Share of UK output by sector (%). Stacked bar chart with 4 horizontal bars. The value axis (x-axis) is "Share of UK output in %", from 0 to 100 marked every 10; the bars are labelled along the y-axis, "Year", from top to bottom. Each bar is split into 3 parts, shown in the key: Primary (left, blue), Secondary (middle, orange) and Tertiary (right, green). Values: 1990: primary 3%, secondary 27%, tertiary 70%; 2000: primary 3%, secondary 23%, tertiary 74%; 2010: primary 2%, secondary 19%, tertiary 79%; 2025: primary 1%, secondary 17%, tertiary 82%. The value of each part is printed on it (just outside the bar, next to the part, where a part is too thin).

Model answer

Figure 1 shows a big shift in the UK economy. The tertiary sector's share of output rose from 70% in 1990 to 82% in 2025, while the secondary sector's share fell from 27% to 17% and the primary sector's share fell from 3% to 1%.

One reason for the growth of the tertiary sector is rising incomes. As people become better off, they already own most of the goods they need, so they spend more of each extra pound on services such as eating out, holidays, entertainment and financial services. The UK also has strengths in services such as banking, law, education and creative industries, and it sells many of these services abroad. An ageing population has increased the demand for health and social care. All of this means service businesses have grown faster than the rest of the economy.

The secondary sector's share has fallen partly because of competition from countries with lower labour costs. Many goods, such as clothing and electronics, can be made more cheaply in Asia, so manufacturing moved abroad and the UK imports more of these goods instead. In addition, automation means that factories make goods with fewer workers, and the prices of manufactured goods have fallen, so even when the amount produced stays the same, it makes up a smaller share of the value of output.

The primary sector's share fell from 3% to 1% mainly because coal mining ended and output of North Sea oil and gas has declined as the fields have been used up. However, a falling share does not necessarily mean the sector is producing less: the secondary sector's share fell because the tertiary sector grew much faster, so the changes in Figure 1 reflect both growth in services and decline in some industries.

Explanation

A Level 3 answer uses the data (for example the tertiary share rising from 70% to 82% and the secondary share falling from 27% to 17%) and builds chains of reasoning for why each sector changed, such as rising incomes leading to more spending on services, or cheaper production abroad leading to more imports of goods. A good answer also notices that a smaller share is not necessarily a smaller amount.

Mark scheme
  1. 6 marks

    Levels of response (6 marks).
    Level 3 (5-6 marks): A full analysis of the economic evidence, a well-developed and logical chain of reasoning.
    Level 2 (3-4 marks): An incomplete analysis of the economic evidence, starts to develop a chain of reasoning. Good application of knowledge and understanding of concepts/issues mostly relevant to the context.
    Level 1 (1-2 marks): Analysis of discrete points of the economic evidence with no chain of reasoning attempted. Basic application of knowledge and understanding of concepts/issues with limited relevance to the context.
    0 marks: Nothing written worthy of credit.

    Max 4 if the answer makes no use of the evidence or context given. Levels are a ladder, as AQA instructs: an answer reaches Level 3 only if it also applies knowledge to the context, as Level 2 requires. Indicative content (not exhaustive; credit other valid points): use of the data: tertiary share rose from 70% to 82%; secondary share fell from 27% to 17%; primary share fell from 3% to 1%; the change is steady over the period, with the largest fall in the secondary share between 1990 and 2010; reasons for the growth of the tertiary sector: rising incomes, so households spend more on services (leisure, eating out, travel, financial services); an ageing population needing more health and social care; the UK's strengths in finance, business services, education and creative industries, which are also exported; new technology creating digital services; reasons for the decline of the secondary sector: competition from countries with lower labour costs (e.g. in Asia), so manufacturing moved abroad and the UK imports more goods; automation means goods are made with fewer workers and their prices have fallen, so they are a smaller share of output value; reasons for the decline of the primary sector: falling North Sea oil and gas output and the end of coal mining; farming has stayed small. Analysis may note that a smaller share does not always mean a smaller amount: output of the secondary sector can still grow even if its share falls.

Ready to try the rest? Every answer you write is marked against the mark scheme, so you can see exactly where the marks are.

Study Helper Hints first, answers after you try

Stuck on this one? Ask for a hint and I’ll point you in the right direction, without giving the answer away. Once you’ve checked your answer, I’ll show you how the marks are awarded.