Level:
Correct: 0
Incorrect: 0
Marks: 0/0
Exam Practice
Course:
Topics:
AQA GCSE Economics (Paper 1) Smart practice A mixed round aimed at your weak spots
Unit 1
Economic foundations
Economic activity
Economic activity
The factors of production
Unit 2
Resource allocation
Markets and allocation of resources
Markets and the allocation of resources
Economic sectors
Economic sectors
Specialisation, division of labour, and exchange
Specialisation, division of labour and exchange
Unit 3
How prices are determined
Demand for goods and services
Supply for goods and services
Supply of goods and services
Equilibrium price
Equilibrium price
Intermarket relationships
Price elasticity of demand
Price elasticity of supply
Unit 4
Production, costs, revenue and profit
The importance of cost, revenue and profit for producers
Cost, revenue and profit for producers
Production and productivity
Economies of scale
Economies of scale
Unit 5
Competitive and concentrated markets
The importance of market structures on producers and consumers
Market structures
Competitive markets
Competitive markets
The labour market
The labour market
Unit 6
Market failure
Avg
score:
–
Topics
done:
0/21

Equilibrium price

Practise 19 exam-style questions on Equilibrium price for AQA GCSE Economics (Paper 1). Write your answer as you would in the exam and get it marked in seconds against the mark scheme, point by point, with the Study Helper on hand if you get stuck.

  • 19 questions
  • 1–15 marks each
  • Instant marking
  • No sign-up needed
19 questions, marked as you go

Sample questions with model answers

Here are 4 of the questions in this topic, each with a model answer, an explanation of why it earns the marks and the mark scheme an examiner would use.

Question 1

1 mark

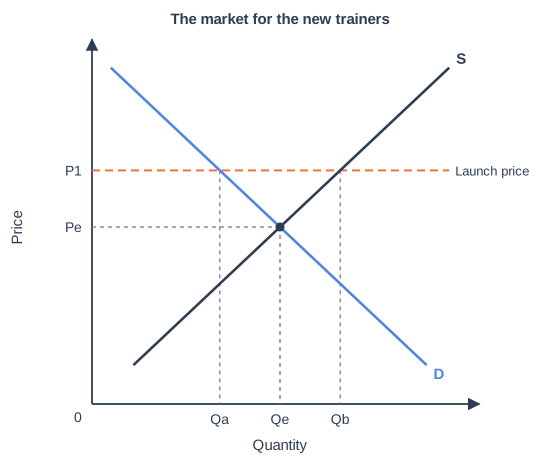
Figure 1 shows the market for a new range of trainers. The manufacturer launches them at a price of P1 and keeps the price at P1 for the first month.

Which statement is correct?

Choose your answer.

  • A There is excess supply, equal to Qb - Qa.
  • B There is excess demand, equal to Qb - Qa.
  • C There is excess supply, equal to Qb - Qe.
  • D The market is in equilibrium at P1.
The market for the new trainers. A supply and demand diagram with price on the vertical axis and quantity on the horizontal axis (no values are shown). D is a demand curve that slopes downwards from left to right. S is a supply curve that slopes upwards from left to right. D and S cross at price Pe and quantity Qe (dashed lines to the axes). A horizontal dashed line labelled "Launch price" (marked P1 on the vertical axis) is drawn across the diagram (above Pe, where D and S cross). It meets D at quantity Qa and S at quantity Qb; Qb is greater than Qa.

Model answer

A There is excess supply, equal to Qb - Qa.

Explanation

P1 is above the equilibrium price Pe. At P1 consumers demand only Qa pairs (where the price line meets D) but Qb pairs are supplied (where it meets S), so there is excess supply, a surplus of unsold trainers, equal to Qb - Qa. Qb - Qe compares supply with the equilibrium quantity, not with the quantity demanded at P1. The surplus is likely to lead the manufacturer to cut the price towards Pe.

Mark scheme
  1. 1 mark

    A / There is excess supply, equal to Qb - Qa.

    Accept the letter or the option text. If more than one option is given, 0 marks.

Question 2

2 marks

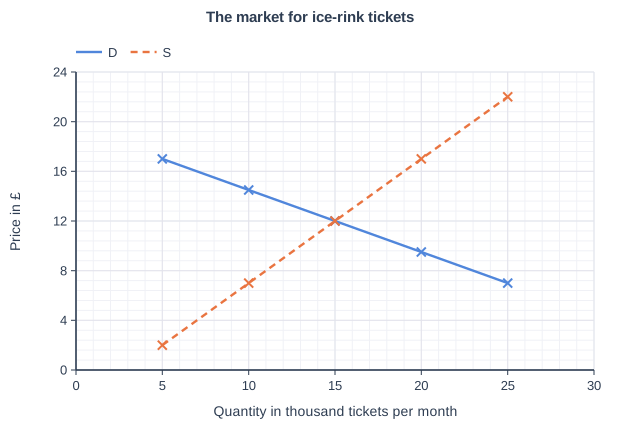
Figure 1 shows the demand curve (D) and the supply curve (S) for tickets at an ice rink in a city.

Using Figure 1, calculate the total revenue received by the ice rink each month at the equilibrium price.

Give your answer in £.

The market for ice-rink tickets. Line graph of price in £ (y-axis, 0 to 24) against quantity in thousand tickets per month (x-axis, 0 to 30). "D" joins the points (5, 17), (10, 14.5), (15, 12), (20, 9.5), (25, 7). "S" (dashed) joins the points (5, 2), (10, 7), (15, 12), (20, 17), (25, 22).

Model answer

At equilibrium D and S cross at a price of £12 and a quantity of 15 thousand tickets per month.
Total revenue = price × quantity = £12 × 15 000 = £180 000 per month.

Explanation

First find the equilibrium where the demand and supply curves cross, then use total revenue = price × quantity. On a supply and demand diagram this is the area of the rectangle from the origin up to the equilibrium point. Remember that the quantity axis is in thousands, so 15 means 15 000 tickets.

Mark scheme
  1. 1 mark

    Identifies the equilibrium from the graph: price £12 and quantity 15 thousand (15 000) tickets per month, e.g. £12 × 15 000; or a correct final answer of £180 000 with no working

    An answer of £180 000 with no working scores 2 marks. 1 mark for the correct equilibrium price and quantity if the final answer is wrong or missing. An answer of £180 (ignoring that the quantity is in thousands) scores 1 mark.

  2. 1 mark

    £180 000

    Accept 180 000 or 180000 with or without the £ sign, and £180 thousand / £0.18 million.

Question 3

2 marks

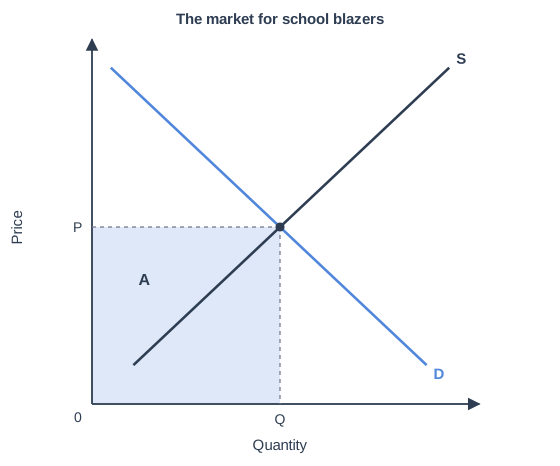
Figure 1 shows the market for school blazers in a town, which is in equilibrium at price P and quantity Q.

Explain what the shaded area labelled A shows.

The market for school blazers. A supply and demand diagram with price on the vertical axis and quantity on the horizontal axis (no values are shown). D is a demand curve that slopes downwards from left to right. S is a supply curve that slopes upwards from left to right. D and S cross at price P and quantity Q (dashed lines to the axes). The rectangle from the origin up to price P and quantity Q is shaded and labelled A.

Model answer

Area A shows the total revenue that sellers receive from blazers (which is also consumers' total spending on them). It is the equilibrium price P multiplied by the quantity sold Q: the height of the rectangle is the price and its width is the quantity.

Explanation

On a supply and demand diagram, the rectangle from the origin up to the equilibrium point has an area of price × quantity, which is total revenue. The first mark is for naming total revenue and the second for showing it is P × Q. Calling the area 'profit' is a common error: profit would also need the firms' costs, which the diagram does not show.

Mark scheme
  1. 1 mark

    Total revenue (of the sellers of blazers) / total spending by consumers on blazers

    Do not accept 'profit', 'total cost' or 'the price'. Revenue is not profit.

  2. 1 mark

    Explains how it is found: equilibrium price × quantity sold, P × Q (the height of the rectangle is the price and its width the quantity)

    2 marks = 'total revenue, the equilibrium price P multiplied by the quantity sold Q'. 1 mark = 'total revenue' alone. 'P × Q' alone, without saying that it is total revenue (or consumers' total spending), scores 0, because this mark depends on the first.

Question 4

6 marks

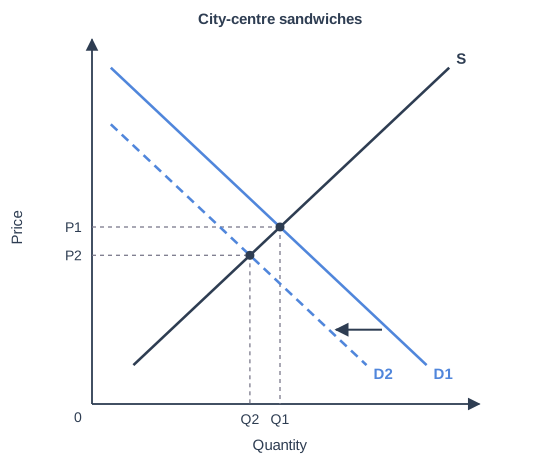
Since more people started working from home for part of the week, fewer office workers buy their lunch in city centres. Figure 1 shows the effect on the market for sandwiches sold in a city centre.

Using Figure 1, analyse the effects of this change on the market for city-centre sandwiches.

City-centre sandwiches. A supply and demand diagram with price on the vertical axis and quantity on the horizontal axis (no values are shown). D1 is a demand curve that slopes downwards from left to right. D2 is a demand curve (dashed) that slopes downwards from left to right, parallel to D1 and to the left of it. S is a supply curve that slopes upwards from left to right. An arrow shows a shift from D1 to D2. D1 and S cross at price P1 and quantity Q1 (dashed lines to the axes). D2 and S cross at price P2 and quantity Q2 (dashed lines to the axes). On the axes, P2 is lower than P1 and Q2 is smaller than Q1.

Model answer

Working from home is a non-price factor, so it shifts the demand curve for city-centre sandwiches to the left, from D1 to D2: fewer sandwiches are demanded at every price because there are fewer office workers in the city centre at lunchtime.

At the original price P1 there is now excess supply: sandwich shops make more sandwiches than people want to buy, so they are left with unsold stock, which is wasted because sandwiches go off quickly. To reduce this, sellers cut their prices and make fewer sandwiches. As the price falls, quantity supplied contracts along the supply curve and quantity demanded extends along D2, until a new equilibrium is reached at the lower price P2 and the smaller quantity Q2.

As a result, the total revenue of sandwich sellers falls. Revenue is price × quantity, and both have fallen, from P1 × Q1 to P2 × Q2, so the revenue rectangle is smaller on both sides. Lower revenue means lower profits, so some sandwich shops may cut opening hours or staff, or close altogether, especially on Mondays and Fridays when fewer people come into the office. If shops close, supply would also fall over time.

Sellers may respond by trying to win back demand, for example by offering delivery, loyalty schemes or meal deals. Meanwhile, demand for sandwiches near people's homes in the suburbs may increase, so the change moves business from city-centre shops to local ones.

Explanation

Top answers read the figure correctly (a leftward shift of demand, with price falling from P1 to P2 and quantity from Q1 to Q2) and develop the chain: excess supply at P1, price cuts, movements along the curves, the new equilibrium and lower revenue (P2 × Q2 is smaller than P1 × Q1). Further consequences such as closures or changes to supply reach Level 3. Confusing the shift of demand with a shift of supply is a serious error.

Mark scheme
  1. 6 marks

    Levels of response (6 marks).
    Level 3 (5-6 marks): A full analysis of the economic evidence, a well-developed and logical chain of reasoning.
    Level 2 (3-4 marks): An incomplete analysis of the economic evidence, starts to develop a chain of reasoning. Good application of knowledge and understanding of concepts/issues mostly relevant to the context.
    Level 1 (1-2 marks): Analysis of discrete points of the economic evidence with no chain of reasoning attempted. Basic application of knowledge and understanding of concepts/issues with limited relevance to the context.
    0 marks: Nothing written worthy of credit.

    Max 4 if the answer makes no use of the evidence or context given. Levels are a ladder, as AQA instructs: an answer reaches Level 3 only if it also applies knowledge to the context, as Level 2 requires. Indicative content (not exhaustive; credit other valid points): Use of the evidence: demand shifts to the left from D1 to D2 because fewer office workers are in the city centre (a change in a non-price factor, so a shift, not a movement); the equilibrium moves from P1 and Q1 to the lower price P2 and the smaller quantity Q2. Possible chains of reasoning: at the old price P1 there is now excess supply (unsold sandwiches, waste); sellers cut prices to clear their stock; as the price falls, quantity demanded extends and quantity supplied contracts (a movement along S) until a new equilibrium is reached at P2 and Q2; total revenue falls from P1 × Q1 to P2 × Q2 because both price and quantity are lower (the revenue rectangle shrinks); lower revenue may mean lower profits, so some sandwich shops may close or cut staff and opening hours; over time some sellers may leave the market, shifting supply to the left; sellers may try to win back demand, e.g. with delivery, loyalty schemes or new products; the effect is strongest on the days most people work from home. Credit analysis of related effects, e.g. on suppliers of bread and fillings, or on sandwich shops in suburbs, where demand may increase. Answers that say the supply curve shifts because of fewer office workers, or that the price falls because supply falls, cannot go above Level 1.

Ready to try the rest? Every answer you write is marked against the mark scheme, so you can see exactly where the marks are.

Study Helper Hints first, answers after you try

Stuck on this one? Ask for a hint and I’ll point you in the right direction, without giving the answer away. Once you’ve checked your answer, I’ll show you how the marks are awarded.