Level:
Correct: 0
Incorrect: 0
Marks: 0/0
Exam Practice
Course:
Topics:
AQA GCSE Psychology (Paper 1) Smart practice A mixed round aimed at your weak spots
Unit 1
Memory
Processes of memory
Processes of memory
Memory as an active process
Unit 2
Perception
Sensation and perception; visual cues and constancies
Sensation and perception, visual cues and constancies
Gibson's direct theory of perception - the influence of nature
Gibson's direct theory of perception
Visual illusions
Visual illusions
Gregory's constructivist theory of perception - the influence of nurture
Gregory's constructivist theory of perception
Factors affecting perception
Unit 3
Development
Early brain development
Piaget's stage theory and the development of intelligence; the role of Piaget's theory in education
Piaget's stage theory and the development of intelligence
The effects of learning on development
Unit 4
Research methods
Avg
score:
–
Topics
done:
0/24

Normal distributions

Practise 18 exam-style questions on Normal distributions for AQA GCSE Psychology (Paper 1). Write your answer as you would in the exam and get it marked in seconds against the mark scheme, point by point, with the Study Helper on hand if you get stuck.

  • 18 questions
  • 1–9 marks each
  • Instant marking
  • No sign-up needed
18 questions, marked as you go

Sample questions with model answers

Here are 4 of the questions in this topic, each with a model answer, an explanation of why it earns the marks and the mark scheme an examiner would use.

Question 1

1 mark

The reaction times of 600 participants in a computer task formed a normal distribution. The mean reaction time was 0.42 seconds.

Which one of the following is most likely to be true?

Choose your answer.

  • The mode was much lower than the mean
  • The median and the mode were both about 0.42 seconds
  • Most participants had reaction times far from 0.42 seconds
  • The median was half of the mean, at 0.21 seconds

Model answer

The median and the mode were both about 0.42 seconds

Explanation

In a normal distribution the mean, median and mode all fall at the centre of the curve, so they have the same or almost the same value, here about 0.42 seconds. Most scores are close to the mean, not far from it, and a mode much lower than the mean would mean the distribution was not symmetrical.

Mark scheme
  1. 1 mark

    The median and the mode were both about 0.42 seconds

    If more than one option is given, 0 marks.
Question 2

2 marks

A psychologist, Dr Kerimova (fictional), gave a memory test to 800 adults. In her report, she wrote that the scores 'showed a normal distribution'.

Explain what is meant by a 'normal distribution'.

Model answer

A normal distribution is a pattern of scores that forms a symmetrical, bell-shaped curve when plotted on a graph. Most people's scores are close to the mean, with fewer and fewer scores towards the very high and very low extremes, and the mean, median and mode are all at the centre of the curve.

Explanation

For 2 marks, describe the shape (symmetrical and bell-shaped) and add at least one other characteristic, such as most scores being near the mean or the mean, median and mode being equal. 'Normal' does not mean 'typical' or 'what most people expect', which is a common muddle.

Mark scheme
  1. 2 marks

    Up to 2 marks for an explanation of a normal distribution. 2 marks: a clear and accurate explanation. 1 mark: a limited or muddled explanation.

    Possible content: A normal distribution is a symmetrical, bell-shaped spread of scores when they are plotted on a graph. Most scores are close to the mean, with fewer and fewer scores towards the extremes. The mean, median and mode are all equal and at the centre (the highest point of the curve). The tails of the curve approach the horizontal axis. Credit other relevant content. NOTE: To be considered clear and accurate, answers must refer to the shape (symmetrical/bell-shaped) AND one other characteristic (e.g. most scores near the mean with fewer at the extremes, or the mean, median and mode being equal/at the centre). Examples: 'A symmetrical, bell-shaped curve where most people score near the average and few score very high or very low' (2 marks). 'The scores form a bell shape' (1 mark). 'When the results are normal or typical' (0 marks).

Question 3

2 marks

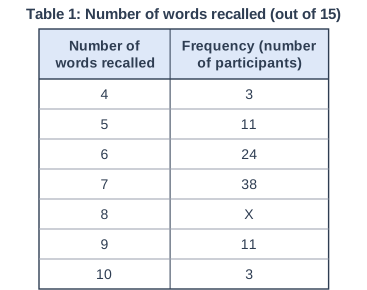
A psychologist asked 114 participants to learn a list of 15 words and then recall as many as they could. Table 1 shows how many words the participants recalled. The frequencies formed a perfectly symmetrical normal distribution.

State the value of X. Explain how you know.

Table 1: Number of words recalled (out of 15). Table with columns "Number of words recalled", "Frequency (number of participants)". Number of words recalled: 4; Frequency (number of participants): 3 | Number of words recalled: 5; Frequency (number of participants): 11 | Number of words recalled: 6; Frequency (number of participants): 24 | Number of words recalled: 7; Frequency (number of participants): 38 | Number of words recalled: 8; Frequency (number of participants): X | Number of words recalled: 9; Frequency (number of participants): 11 | Number of words recalled: 10; Frequency (number of participants): 3.

Model answer

X = 24. A normal distribution is symmetrical about the middle score, which is 7 words. Recalling 8 words is one step above the middle, so it must have the same frequency as recalling 6 words, one step below the middle: 24. (Check: 3 + 11 + 24 + 38 + 24 + 11 + 3 = 114.)

Explanation

Because a normal distribution is symmetrical, frequencies the same distance either side of the centre are equal, so the frequency for 8 words matches the frequency for 6 words. You can check by adding all the frequencies, which must come to the 114 participants.

Mark scheme
  1. 1 mark

    1 mark for the correct answer: 24

    Do not accept 38 (the frequency of the middle score).

  2. 1 mark

    1 mark for an explanation, e.g. a normal distribution is symmetrical about the middle score (7 words), so 8 words must have the same frequency as 6 words (24) / the total is 114, and 114 - (3 + 11 + 24 + 38 + 11 + 3) = 24.

    Accept either explanation. The explanation can only be credited if X = 24 is given.

Question 4

3 marks

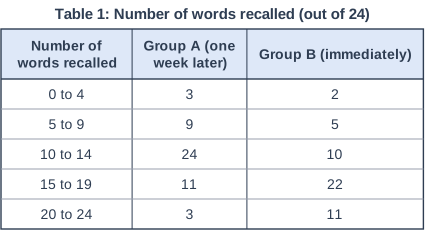
A researcher asked 100 participants to learn a list of 24 words. Group A (50 participants) recalled the words one week later. Group B (50 participants) recalled the words immediately. Table 1 shows the number of words recalled.

Which group's scores are closer to a normal distribution? Use the data in Table 1 to explain your answer.

Table 1: Number of words recalled (out of 24). Table with columns "Number of words recalled", "Group A (one week later)", "Group B (immediately)". Number of words recalled: 0 to 4; Group A (one week later): 3; Group B (immediately): 2 | Number of words recalled: 5 to 9; Group A (one week later): 9; Group B (immediately): 5 | Number of words recalled: 10 to 14; Group A (one week later): 24; Group B (immediately): 10 | Number of words recalled: 15 to 19; Group A (one week later): 11; Group B (immediately): 22 | Number of words recalled: 20 to 24; Group A (one week later): 3; Group B (immediately): 11.

Model answer

Group A's scores are closer to a normal distribution. Group A's most common class is the middle one, 10 to 14 words (24 participants), and the frequencies fall away almost evenly on both sides: 9 and 11 participants in the next classes, then 3 and 3 at the extremes. This is roughly symmetrical, with most scores in the middle. Group B's scores are not symmetrical: the most common class is 15 to 19 words (22 participants), and there are far more participants at the top (11 recalled 20 to 24 words) than at the bottom (only 2 recalled 0 to 4).

Explanation

Full marks need the correct group and data that show the shape: a peak in the middle class with similar frequencies on each side for Group A, and a peak towards the top with unequal tails for Group B. Saying that Group A 'looks more normal' without quoting frequencies earns only partial credit.

Mark scheme
  1. 3 marks

    Up to 3 marks for identifying Group A and using Table 1 to explain this. 3 marks: a clear and accurate explanation explicitly using accurate data from Table 1 PLUS correctly identifying Group A. 2 marks: a limited or muddled explanation PLUS correctly identifying Group A OR only a clear and accurate explanation explicitly using accurate data from Table 1. 1 mark: a limited or muddled explanation OR only correctly identifying Group A. 0 marks: identifying Group B.

    Possible content: Group A's scores are closer to a normal distribution. Group A's highest frequency (24) is in the middle class (10 to 14 words) and the frequencies fall away fairly evenly on both sides (9 and 11, then 3 and 3), so the distribution is roughly symmetrical, with most scores in the middle and few at the extremes. Group B's highest frequency (22) is in the 15 to 19 class, not the middle; there are far more scores at the high end (11 in 20 to 24) than at the low end (2 in 0 to 4), so it is not symmetrical. Credit other relevant content. NOTE: To be considered clear and accurate, the explanation must use data to show that Group A is roughly symmetrical with its peak in the middle and/or that Group B is not.

Ready to try the rest? Every answer you write is marked against the mark scheme, so you can see exactly where the marks are.

Study Helper Hints first, answers after you try

Stuck on this one? Ask for a hint and I’ll point you in the right direction, without giving the answer away. Once you’ve checked your answer, I’ll show you how the marks are awarded.