
Level:
Correct: 0
Incorrect: 0
Marks: 0/0
Exam Practice
Course:
Topics:
AQA GCSE Psychology (Paper 1) Smart practice A mixed round aimed at your weak spots
Unit 1
Memory
Processes of memory
Processes of memory
Memory as an active process
Unit 2
Perception
Sensation and perception; visual cues and constancies
Sensation and perception, visual cues and constancies
Gibson's direct theory of perception - the influence of nature
Gibson's direct theory of perception
Visual illusions
Visual illusions
Gregory's constructivist theory of perception - the influence of nurture
Gregory's constructivist theory of perception
Factors affecting perception
Unit 3
Development
Early brain development
Piaget's stage theory and the development of intelligence; the role of Piaget's theory in education
Piaget's stage theory and the development of intelligence
The effects of learning on development
Unit 4
Research methods
Avg
score:
–
Topics
done:
0/24

Interpretation and display of quantitative data

Practise 24 exam-style questions on Interpretation and display of quantitative data for AQA GCSE Psychology (Paper 1). Write your answer as you would in the exam and get it marked in seconds against the mark scheme, point by point, with the Study Helper on hand if you get stuck.

  • 24 questions
  • 1–9 marks each
  • Instant marking
  • No sign-up needed
20 questions, marked as you go

Sample questions with model answers

Here are 4 of the questions in this topic, each with a model answer, an explanation of why it earns the marks and the mark scheme an examiner would use.

Question 1

1 mark

A psychologist gave four groups of participants the same list of 20 words to learn. Each group used a different method: repeating each word aloud, writing each word out, making up a sentence containing each word, or drawing a picture of each word. The bar chart shows the mean number of words recalled by each group.

Which one of the following statements is supported by the bar chart?

Choose your answer.

  • The group who drew pictures had the highest mean
  • The mean for the group who wrote each word out was 12 words
  • Making up sentences gave a mean 6 words higher than repeating aloud
  • Making up sentences gave twice as many words as writing each word out
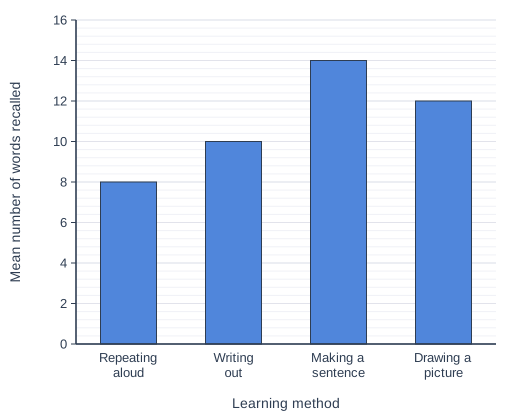
Bar chart of mean number of words recalled for each learning method: Repeating aloud 8, Writing out 10, Making a sentence 14, Drawing a picture 12.

Model answer

Making up sentences gave a mean 6 words higher than repeating aloud

Explanation

Read each bar against the vertical axis: repeating aloud 8, writing out 10, making a sentence 14 and drawing a picture 12, so making a sentence was 14 - 8 = 6 words higher than repeating aloud. Each wrong statement comes from misreading the chart, for example reading the neighbouring bar or treating 14 as twice 10.

Mark scheme
  1. 1 mark

    Making up sentences gave a mean 6 words higher than repeating aloud

    If more than one option is given, 0 marks. The means are: repeating aloud 8, writing out 10, making a sentence 14, drawing a picture 12. 14 - 8 = 6. The highest mean is for making a sentence, not drawing a picture; the writing-out mean is 10 (12 is the drawing-a-picture bar); 14 is not twice 10.
Question 2

2 marks

A psychologist, Dr Esposito (fictional), read the same story to two groups of 7-year-old children. One group saw pictures while they listened and the other group saw no pictures. She then calculated the mean number of details from the story that the children in each group recalled.

Name the most suitable type of graph for displaying the two mean scores. Explain your answer.

Model answer

A bar chart. The two conditions (pictures and no pictures) are separate categories rather than continuous data, so each condition is shown by its own bar with a gap between the bars, and the heights of the two bars make it easy to compare the mean number of details recalled.

Explanation

A bar chart is used when the horizontal axis shows separate categories, such as the two conditions of an independent variable, and the height of each bar shows a value such as a mean. A histogram is only for continuous data grouped into classes, and a scatter diagram is for the relationship between two co-variables, so neither suits two condition means.

Mark scheme
  1. 1 mark

    Bar chart

    Accept bar graph. Do not accept histogram, scatter diagram, line graph or pie chart. NOTE: If the candidate has written more than one type of graph, only mark the first one.

  2. 1 mark

    1 mark for an explanation, e.g. the two conditions (pictures and no pictures) are separate categories, not continuous data, so each condition has its own bar with a gap between the bars / the heights of the two bars allow the two means to be compared easily.

    The explanation can only be credited if a bar chart has been named. Do not accept 'it is the easiest graph' with no reason. Do not accept explanations about showing a relationship between two co-variables (that is a scatter diagram).

Question 3

3 marks

A psychologist, Dr Bakshi (fictional), showed 90 participants an ambiguous drawing that could be seen either as an animal or as a building. Before seeing it, 30 participants were told that they would see pictures of animals, 30 were told that they would see pictures of buildings, and 30 were told nothing. Each participant said what they saw first.

Dr Bakshi's hypothesis was: 'Participants who are told they will see animals will be more likely to see an animal in the drawing than participants who are told nothing.'

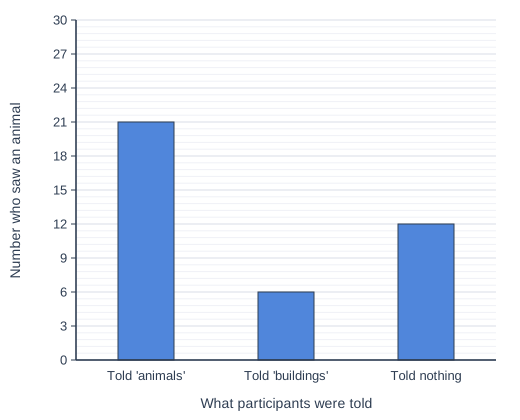
The bar chart shows the number of participants in each group who saw an animal.

Do the results in the bar chart support Dr Bakshi's hypothesis? Use data from the bar chart to explain your answer.

Bar chart of number who saw an animal for each what participants were told: Told 'animals' 21, Told 'buildings' 6, Told nothing 12.

Model answer

Yes, the results support the hypothesis. 21 of the 30 participants who were told they would see animals saw an animal, compared with only 12 of the 30 participants who were told nothing. Because both groups contained 30 participants, this is a fair comparison: 9 more people saw an animal when they expected animals (70% compared with 40%).

Explanation

Full marks need a clear decision (the hypothesis is supported) and accurate figures read from the bar chart that compare the two groups named in the hypothesis: 21 in the 'animals' group and 12 in the 'told nothing' group. Common mistakes are comparing the wrong groups or saying the hypothesis is supported without quoting any data.

Mark scheme
  1. 3 marks

    Up to 3 marks for stating that the results support the hypothesis and using the bar chart to explain this. 3 marks: a clear and accurate explanation explicitly using accurate data from the bar chart PLUS correctly stating that the results support the hypothesis. 2 marks: a limited or muddled explanation PLUS correctly stating that the results support the hypothesis OR only a clear and accurate explanation explicitly using accurate data from the bar chart. 1 mark: a limited or muddled explanation OR only correctly stating that the results support the hypothesis. 0 marks: incorrectly stating that the results do not support the hypothesis.

    Possible content: The results support the hypothesis. 21 of the 30 participants who were told to expect animals saw an animal, compared with 12 of the 30 who were told nothing: 9 more participants, or 70% compared with 40%. The groups were the same size (30), so the numbers can be compared directly. The 'buildings' group (6, or 20%) is not part of the hypothesis but shows the opposite effect, which fits the idea that expectation affects perception. Credit other relevant content. NOTE: To be considered clear and accurate, the explanation must compare the 'animals' group with the 'told nothing' group using accurate figures from the bar chart. NOTE: Comparing only the 'animals' group with the 'buildings' group does not test this hypothesis (MAX 2 marks).

Question 4

6 marks

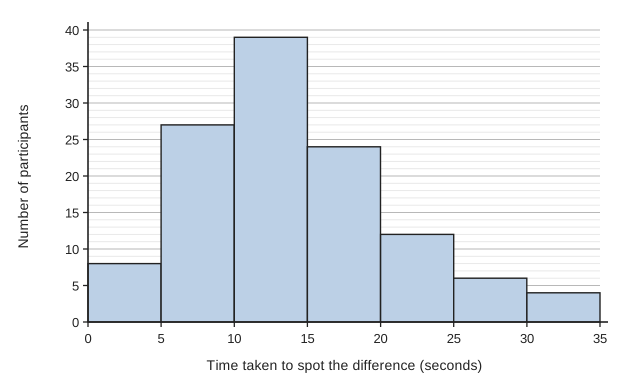
A psychologist, Dr Prakash (fictional), showed 120 participants two almost identical pictures and timed how long each participant took to spot the one difference between them. She displayed the results in the histogram shown.

Explain the strengths and weaknesses of using a histogram to display these results. In your answer, refer to Dr Prakash's histogram.

Histogram with touching bars. Horizontal axis: Time taken to spot the difference (seconds), marked at the class boundaries 0, 5, 10, 15, 20, 25, 30, 35. Vertical axis: Number of participants, from 0 to 40 with gridlines every 5 and fainter lines every 1. Bar heights: 0 to 5 seconds: 8; 5 to 10 seconds: 27; 10 to 15 seconds: 39; 15 to 20 seconds: 24; 20 to 25 seconds: 12; 25 to 30 seconds: 6; 30 to 35 seconds: 4.

Model answer

A histogram is the right kind of graph for these results because time is continuous data, so the classes follow on from each other and the bars touch. One strength is that it summarises 120 separate times in just seven bars, so the pattern can be seen at a glance. Dr Prakash's histogram shows that the most common time was 10 to 15 seconds (39 participants), that 66 of the 120 participants (55%) spotted the difference in 5 to 15 seconds, and that only 10 took 25 seconds or longer. It also shows the shape and spread of the data: most people were fairly quick, with a longer tail of a few slow participants. This would be much harder to see in a list of 120 numbers.

However, the histogram loses the individual times. We cannot tell exactly how fast the quickest participant was or how slow the slowest was, so the exact range, mean and median cannot be calculated, only estimated. The appearance also depends on the class width: with 10-second classes the pattern would look different and some detail would be lost. Finally, a histogram shows only one variable, so it cannot explain why some participants were slower, or compare different conditions, unless more than one histogram is drawn.

Overall, a histogram is a clear and appropriate way to show the distribution of the times, but it should be used alongside descriptive statistics calculated from the raw data.

Explanation

Level 3 answers explain why a histogram suits continuous time data and use specific values from Dr Prakash's histogram, such as the 10 to 15 second class with 39 participants, to show what it reveals about the shape and spread of the times. They balance this against what is lost, especially the individual scores, and end with a justified conclusion; answers that discuss graphs in general without using the histogram cannot reach Level 3.

Mark scheme
  1. 6 marks

    Levels of response (6 marks). AO2 - 2 marks and AO3 - 4 marks.
    Level 3 Detailed (5-6 marks): AO2: Clear application of knowledge and understanding of the strengths and weaknesses of using a histogram to Dr Prakash's study of spotting the difference between two pictures. AO3: Analysis and evaluation of the strengths and weaknesses of using histograms in psychological research is effective. Any conclusions drawn are sound and fully expressed. Relevant terminology is used consistently throughout. The answer demonstrates a high level of substantiated reasoning, and is clear, coherent and focused.
    Level 2 Clear (3-4 marks): AO2: Reasonable application of knowledge and understanding of the strengths and weaknesses of using a histogram to Dr Prakash's study of spotting the difference between two pictures. AO3: There may be some effective analysis and evaluation of the strengths and/or weaknesses of using histograms in psychological research. There may be an attempt to draw conclusions. Relevant terminology is usually used. The answer frequently demonstrates substantiated reasoning and is clear, generally coherent and focused although structure may lack some logic.
    Level 1 Basic (1-2 marks): AO2: Limited application of knowledge and understanding of the strengths and weaknesses of using a histogram to Dr Prakash's study of spotting the difference between two pictures. AO3: Analysis and evaluation of the strengths and/or weaknesses of using histograms in psychological research is of limited effectiveness or may be absent. Any attempts to draw conclusions are not always successful or present. Relevant terminology is occasionally used. The answer occasionally demonstrates substantiated reasoning, but may lack clarity, coherence, focus and logical structure.
    0 marks: No relevant content.

    Possible content (not a checklist): AO2 - Time is continuous data, so a histogram with touching bars is the correct type of graph. It summarises 120 times in seven bars and shows at a glance that the most common time was 10 to 15 seconds (39 participants), that 66 of the 120 participants (55%) took between 5 and 15 seconds, and that only 10 took 25 seconds or longer; the times are spread from 0 to 35 seconds, with a longer tail of slower times. However, the exact times are lost: we cannot tell the fastest or slowest time, so the exact range, mean or median cannot be worked out from the histogram, only estimated. The shape depends on the class width chosen (5 seconds). AO3 - Strengths: histograms display large amounts of continuous data clearly; they show the shape (distribution) and spread of the scores, so patterns such as a few unusually slow participants can be seen; they make it easy to compare the frequencies of different classes; they turn numerical data into a visual form that is quick to interpret. Weaknesses: individual scores are lost, so descriptive statistics cannot be calculated exactly; changing the class width can change the appearance and the conclusions drawn; a histogram shows only one variable, so it cannot show a relationship between variables or compare conditions unless two histograms are drawn; it shows what happened, not why. Conclusion: e.g. a histogram is a suitable way to show the distribution of the times, but it is best used alongside descriptive statistics calculated from the raw data. Credit other relevant content. NOTE: The AO2 may be embedded in the AO3 or separate; both are equally acceptable. NOTE: Reference to timing participants spotting the difference is not enough by itself for relevant content because it is part of the question stem.

Ready to try the rest? Every answer you write is marked against the mark scheme, so you can see exactly where the marks are.

Study Helper Hints first, answers after you try

Stuck on this one? Ask for a hint and I’ll point you in the right direction, without giving the answer away. Once you’ve checked your answer, I’ll show you how the marks are awarded.