Level:
Correct: 0
Incorrect: 0
Marks: 0/0
Practice
Course:
Topics:
Year 4 Maths Smart practice A mixed round aimed at your weak spots
Unit 1
Place value
Unit 2
Addition and subtraction
Column addition
Quick practice5 skills
Column subtraction
Quick practice5 skills
Estimating and checking answers
Quick practice5 skills
Two-step word problems
Quick practice5 skills
Unit 3
Multiplication and division
Unit 4
Fractions
Unit 5
Decimals
Unit 6
Measurement
Measurement
Converting units of measure
Quick practice6 skills
Perimeter
Quick practice5 skills
Area
Quick practice5 skills
Time
Quick practice7 skills
Unit 7
Shape
Geometry: properties of shapes
Triangles and quadrilaterals
Quick practice5 skills
Angles
Quick practice5 skills
Lines of symmetry
Quick practice5 skills
Unit 8
Position and direction
Geometry: position and direction
Coordinates
Quick practice5 skills
Translations
Quick practice4 skills
Unit 9
Statistics
Avg
score:
–
Topics
done:
0/34

Tables and time graphs

Practise 19 questions on Tables and time graphs for Year 4 Maths. Tap your answer and find out straight away if you are right, with the Study Helper on hand if you get stuck.

  • 19 questions
  • 1–5 marks each
  • Instant marking
  • No sign-up needed
19 questions, marked as you go

Sample questions with model answers

Here are 4 of the questions in this topic, each with a model answer, an explanation of why it earns the marks and the mark scheme.

Question 1

1 mark

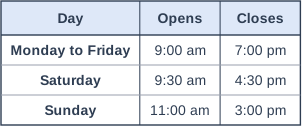
The table shows the opening times of a library.

What time does the library close on Saturday?

Table with columns "Day", "Opens", "Closes". Day: Monday to Friday; Opens: 9:00 am; Closes: 7:00 pm | Day: Saturday; Opens: 9:30 am; Closes: 4:30 pm | Day: Sunday; Opens: 11:00 am; Closes: 3:00 pm.

Model answer

Find the Saturday row and the Closes column: 4:30 pm

Explanation

Find Saturday in the first column, then read across to the Closes column. The library closes at 4:30 pm, which is half past four in the afternoon. A common mistake is to read the Opens column instead.

Mark scheme
  1. 1 mark

    4:30 pm

    Accept 4:30, 16:30 or half past four (in the afternoon). Do not accept 9:30 am (the opening time).

Question 2

2 marks

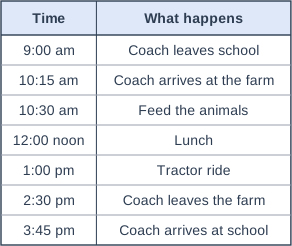
The table shows the timetable for Class 4's trip to a farm.

How long does the coach journey from school to the farm take?

Table with columns "Time", "What happens". Time: 9:00 am; What happens: Coach leaves school | Time: 10:15 am; What happens: Coach arrives at the farm | Time: 10:30 am; What happens: Feed the animals | Time: 12:00 noon; What happens: Lunch | Time: 1:00 pm; What happens: Tractor ride | Time: 2:30 pm; What happens: Coach leaves the farm | Time: 3:45 pm; What happens: Coach arrives at school.

Model answer

Leaves at 9:00 am, arrives at 10:15 am.
9:00 am to 10:00 am is 1 hour.
10:00 am to 10:15 am is 15 minutes.
1 hour 15 minutes

Explanation

Find when the coach leaves school and when it arrives at the farm. Count on from 9:00: one hour takes you to 10:00, then 15 more minutes takes you to 10:15. So the journey takes 1 hour 15 minutes, which is the same as 75 minutes. A common mistake is to take away the times as if they were ordinary numbers and get 115 minutes.

Mark scheme
  1. 1 mark

    Uses 9:00 am and 10:15 am, e.g. 9:00 am to 10:00 am is 1 hour; or the correct answer with no working

  2. 1 mark

    1 hour 15 minutes

    Accept 75 minutes or 1 and a quarter hours. Do not accept 115 minutes or 1.15 hours. A correct answer with no working scores full marks.

Question 3

2 marks

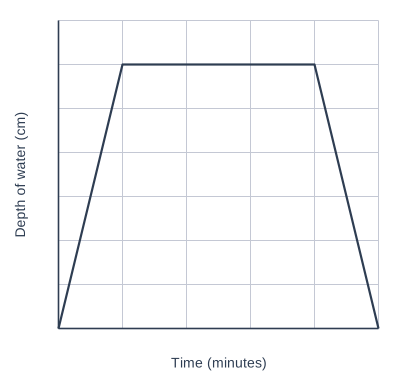
Max filled the sink with water and washed the dishes. Then he let the water out. The line graph shows the depth of the water in the sink.

For how many minutes did the depth of the water stay the same?

A graph of Depth of water (cm) (vertical axis, 0 to 14, marked every 2) against Time (minutes) (horizontal axis, 0 to 25, marked every 5), on a grid. The graph is made of straight-line sections; its values can be read from the grid.

Model answer

The line is flat from 5 minutes to 20 minutes.
\(20 - 5 = 15\)
15 minutes

Explanation

When the depth stays the same, the line on the graph is flat. The flat part starts at 5 minutes and ends at 20 minutes, so it lasts \(20 - 5 = 15\) minutes. That is when Max was washing the dishes. A common mistake is to give the time when the flat part ends.

Mark scheme
  1. 1 mark

    The flat part of the line starts at 5 minutes and ends at 20 minutes; or the correct answer 15 minutes with no working

  2. 1 mark

    15 minutes

    The unit is not needed. Do not accept 12 (the depth) or 20 (the time when the flat part ends). A correct answer with no working scores full marks.

Question 4

4 marks

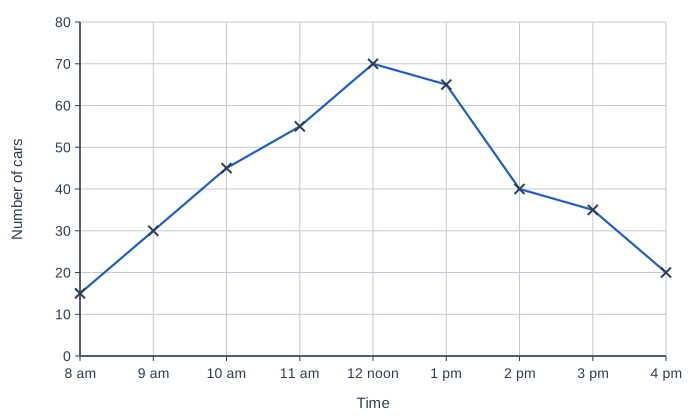
A car park has 80 spaces. The line graph shows how many cars were in the car park at each hour one day.

At which of the times on the graph was the car park more than half full? Tap all of them.

A line graph of the number of cars in a car park. The horizontal axis, Time, shows every hour from 8 am to 4 pm. The vertical axis, Number of cars, goes from 0 to 80 and is numbered every 10, with a grid line at each number. There is a cross at each hour, and the crosses are joined with straight lines. The readings can be read from the graph.

Model answer

Half of 80 is 40.
Readings above 40: 10 am (45), 11 am (55), 12 noon (70), 1 pm (65).
At 2 pm there were exactly 40 cars, which is not more than half.
10 am, 11 am, 12 noon and 1 pm

Explanation

First find half of 80, which is 40. Then look for the crosses that are above the 40 line. There are four: 10 am, 11 am, 12 noon and 1 pm. At 2 pm the cross is exactly on 40, so the car park was exactly half full, not more than half full. A common mistake is to include 2 pm.

Mark scheme
  1. 1 mark

    Half of 80 is 40 (seen or used)

    May be shown by choosing only times above 40.

  2. 1 mark

    At least two correct times from 10 am, 11 am, 12 noon and 1 pm

  3. 1 mark

    All four times: 10 am, 11 am, 12 noon and 1 pm

    Any order. Accept 24-hour times.

  4. 1 mark

    No wrong times in the list

    There are exactly 4 times. 2 pm is wrong: there were exactly 40 cars, which is half full, not more than half full. A list that includes 2 pm or any other wrong time loses this mark only.

Ready to try the rest? Tap your answers and see straight away how you did.

Topic notes

Tables and time graphs

The big idea

A timetable tells you when things happen. A time graph shows how something changes as time goes by, such as the temperature during a day or the height of a growing plant.

Tables and timetables

A table has rows going across and columns going down. To find a fact, run one finger along the right row and another down the right column. The fact is where they meet.

A timetable is a table of times, such as when buses leave or when events start.

Here is the timetable for a school sports day. Each race goes on until the next one starts. Mum arrives at 10:25 am. Which race is happening when she arrives? She has to leave at 11:00 am. Will she see the relay race?

RaceStarts
Egg and spoon race9:30 am
Sack race10:05 am
Three-legged race10:40 am
Relay race11:15 am

10:25 am is after 10:05 am but before 10:40 am. So the sack race, which started at 10:05 am, is happening when Mum arrives.

The relay race starts at 11:15 am. That is later than 11:00 am, so no, Mum will not see it.

Time graphs

A time graph is a kind of line graph. Time goes along the bottom. The thing that was measured goes up the side. Each reading is marked with a cross, and the crosses are joined with straight lines.

To read a time graph:

  1. Read the labels on both axes (the numbered lines), so you know what was measured and its unit, such as metres (m).
  2. Work out the scale: what the numbers up the side go up in.
  3. Find the time along the bottom. Go straight up to the cross, then straight across to read the number.

The line tells a story:

  • where the line goes up, the amount is getting bigger;
  • where the line goes down, the amount is getting smaller;
  • where the line is flat, the amount is staying the same.

The highest cross shows the biggest reading. The lowest cross shows the smallest.

The graph shows how high Jake's kite was each minute. When was the kite highest? Between which minutes did it come down? How far did it fall in the last minute?

A graph of Height (m) (vertical axis, 0 to 40, marked every 5) against Time (minutes) (horizontal axis, 0 to 6, marked every 1), on a grid. The graph is made of straight-line sections joining (0, 0), (1, 10), (2, 20), (3, 35), (4, 25), (5, 30) and (6, 15). (Gradients of the sections from left to right: 10, 10, 15, −10, 5, −15.) A cross is marked at (0, 0). A cross is marked at (1, 10). A cross is marked at (2, 20). A cross is marked at (3, 35). A cross is marked at (4, 25). A cross is marked at (5, 30). A cross is marked at (6, 15).
The height of Jake's kite. The height scale goes up in 5s, and both axes start at 0 (marked O).

Highest: the highest cross is above 3 minutes. Go across to the scale: it is level with 35. The kite was highest after 3 minutes, at 35 m.

Coming down: the line goes down from 3 to 4 minutes and from 5 to 6 minutes, so the kite came down then.

The last minute: after 5 minutes the kite was at 30 m. After 6 minutes it was at 15 m. \(30 - 15 = 15\), so it fell 15 m.

Drawing a time graph

  1. Put time along the bottom, evenly spaced.
  2. Choose a scale up the side that fits the biggest reading.
  3. For each reading, find the time, go up to the reading and make a cross.
  4. Join the crosses in order with a ruler.

A snowman was built on day 0. Ali measured its height every morning. Draw a time graph of the results. On which day was the snowman half as tall as when it was built?

Day012345
Height (cm)807570604020

Put the days 0 to 5 along the bottom. The tallest height is 80 cm, so a scale going up in 10s fits well.

For day 0, find 0 along the bottom (it is marked O), go up to 80 and make a cross. Do the same for every day, then join the crosses.

A graph of Height (cm) (vertical axis, 0 to 90, marked every 10) against Day (horizontal axis, 0 to 5, marked every 1), on a grid. The graph is made of straight-line sections joining (0, 80), (1, 75), (2, 70), (3, 60), (4, 40) and (5, 20). (Gradients of the sections from left to right: −5, −5, −10, −20, −20.) A cross is marked at (0, 80). A cross is marked at (1, 75). A cross is marked at (2, 70). A cross is marked at (3, 60). A cross is marked at (4, 40). A cross is marked at (5, 20).
The height of the snowman each morning. The line goes down, because the snowman was melting.

On day 0 the snowman was 80 cm tall. Half of 80 is 40. The cross that is level with 40 is above day 4. So the snowman was half as tall on day 4.

Common mistakes

  • Reading the wrong row or column of a table. Keep one finger on the row and one on the column.
  • Counting the grid lines in 1s when the scale counts in 5s or 10s. Use the numbers on the scale.
  • Thinking a flat line means 0. It means the amount stayed the same.
  • Taking times away like ordinary numbers. 1010 take away 950 is 60, but from 9:50 am to 10:10 am is not 60 minutes, because an hour has 60 minutes, not 100. Count on instead: 10 minutes to 10:00 am, then 10 more, so it is 20 minutes.

Top tip

Read the title and both axis labels first. Then use a ruler to go up from the time to the cross and across to the scale, so your eyes do not slip.

Study Helper Hints first, answers after you try

Stuck on this one? Ask for a hint and I’ll point you in the right direction, without giving the answer away. Once you’ve checked your answer, I’ll show you how the marks are awarded.