Level:
Correct: 0
Incorrect: 0
Marks: 0/0
Practice
Course:
Topics:
Year 4 Maths Smart practice A mixed round aimed at your weak spots
Unit 1
Place value
Unit 2
Addition and subtraction
Column addition
Quick practice5 skills
Column subtraction
Quick practice5 skills
Estimating and checking answers
Quick practice5 skills
Two-step word problems
Quick practice5 skills
Unit 3
Multiplication and division
Unit 4
Fractions
Unit 5
Decimals
Unit 6
Measurement
Measurement
Converting units of measure
Quick practice6 skills
Perimeter
Quick practice5 skills
Area
Quick practice5 skills
Time
Quick practice7 skills
Unit 7
Shape
Geometry: properties of shapes
Triangles and quadrilaterals
Quick practice5 skills
Angles
Quick practice5 skills
Lines of symmetry
Quick practice5 skills
Unit 8
Position and direction
Geometry: position and direction
Coordinates
Quick practice5 skills
Translations
Quick practice4 skills
Unit 9
Statistics
Avg
score:
–
Topics
done:
0/34

Bar charts and pictograms

Practise 21 questions on Bar charts and pictograms for Year 4 Maths. Tap your answer and find out straight away if you are right, with the Study Helper on hand if you get stuck.

  • 21 questions
  • 1–4 marks each
  • Instant marking
  • No sign-up needed
20 questions, marked as you go

Sample questions with model answers

Here are 4 of the questions in this topic, each with a model answer, an explanation of why it earns the marks and the mark scheme.

Question 1

1 mark

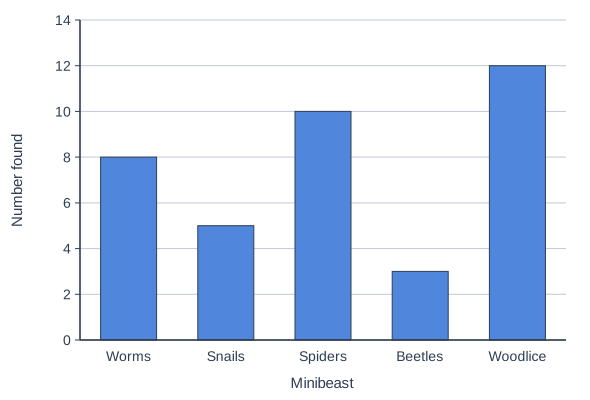
Class 4 went on a minibeast hunt in the school garden. The bar chart shows what they found.

How many spiders did they find?

A bar chart of the number of each minibeast that Class 4 found: Worms, Snails, Spiders, Beetles and Woodlice. The vertical axis, Number found, goes from 0 to 14 and is numbered every 2, with a grid line at each number. The heights of the bars can be read from the scale.

Model answer

The top of the spiders bar is level with 10.
10 spiders

Explanation

Go to the top of the spiders bar and look straight across to the scale. The bar ends exactly on the line marked 10. The scale goes up in 2s, so each gap between the lines is worth 2, not 1. A common mistake is to count the lines and say 5.

Mark scheme
  1. 1 mark

    10

    Do not accept 5 (counting the grid lines instead of reading the scale).

Question 2

2 marks

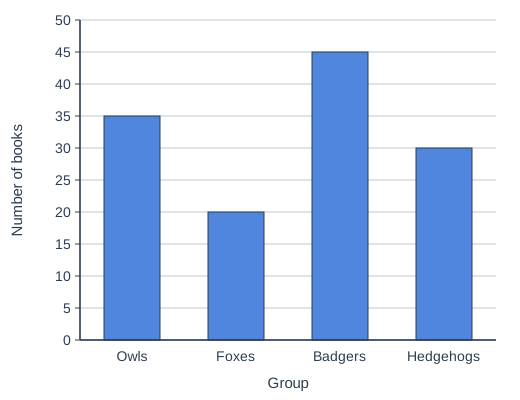
Four groups took part in a reading challenge. The bar chart shows how many books each group read.

How many more books did the Badgers read than the Foxes?

A bar chart of the number of books read by four groups in a reading challenge: Owls, Foxes, Badgers and Hedgehogs. The vertical axis, Number of books, goes from 0 to 50 and is numbered every 5, with a grid line at each number. The heights of the bars can be read from the scale.

Model answer

Badgers: 45
Foxes: 20
\(45 - 20 = 25\)
25 more books

Explanation

Read each bar carefully: the scale goes up in 5s, so the Badgers bar is at 45 and the Foxes bar is at 20. 'How many more' means find the difference, so subtract: \(45 - 20 = 25\). A common mistake is to add the two numbers instead.

Mark scheme
  1. 1 mark

    Badgers 45 and Foxes 20 read correctly; or the correct answer 25 with no working

  2. 1 mark

    25

    Do not accept 65 (the total). If one reading is wrong but their subtraction is correct, award 1 mark in total. A correct answer with no working scores full marks.

Question 3

2 marks

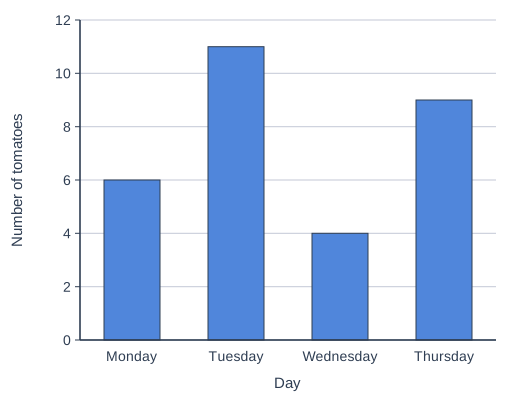
Ravi wrote down how many tomatoes he picked from his garden each day.

Monday: 6
Tuesday: 11
Wednesday: 4
Thursday: 8

He made this bar chart from his list, but he made one mistake.

Which day has the wrong bar? How do you know?

A bar chart of the number of tomatoes Ravi picked on Monday, Tuesday, Wednesday and Thursday. The vertical axis, Number of tomatoes, goes from 0 to 12 and is numbered every 2, with a grid line at each number. The heights of the bars can be read from the scale.

Model answer

Monday 6, Tuesday 11 and Wednesday 4 all match the list.
The Thursday bar stops halfway between 8 and 10, which is 9.
Ravi picked 8 tomatoes on Thursday, so the Thursday bar is wrong.

Explanation

Check each bar against the list, one at a time. The scale goes up in 2s, so a bar that stops halfway between two lines shows an odd number. The Thursday bar shows 9, but it should stop exactly on the line for 8. A common mistake is to choose Tuesday, but halfway between 10 and 12 is 11, which is correct.

Mark scheme
  1. 1 mark

    Thursday

    Do not accept Tuesday: its bar shows 11 (halfway between 10 and 12), which is correct.

  2. 1 mark

    A correct reason: the Thursday bar shows 9 (halfway between 8 and 10), but Ravi picked 8

    Accept 'the bar should stop on the 8 line' or 'the bar is 1 too high'.

Question 4

4 marks

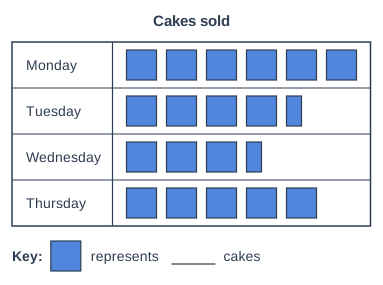
The pictogram shows how many cakes were sold at a bake sale on four days. The number in the key is missing.

24 cakes were sold on Monday.

How many cakes were sold on Wednesday?
How many cakes were sold altogether on the four days?

Pictogram titled "Cakes sold", a table with 4 rows of square symbols. Key: one square represents a number of cakes that is left blank. Monday: 6 squares. Tuesday: 4 and a half squares. Wednesday: 3 and a half squares. Thursday: 5 squares.

Model answer

Monday has 6 squares for 24 cakes, so one square is \(24 \div 6 = 4\) cakes.
Half a square is 2 cakes.
Wednesday: 3 and a half squares = \(12 + 2 = 14\)
Tuesday: 4 and a half squares = \(16 + 2 = 18\)
Thursday: 5 squares = 20
\(24 + 18 + 14 + 20 = 76\) cakes

Explanation

Use Monday to find the key: 6 squares stand for 24 cakes, so each square stands for 4 cakes, because \(6 \times 4 = 24\). Then half a square is 2 cakes. Work out each day and add them all. A common mistake is to guess that each square stands for 2 or 10 cakes without checking with Monday.

Mark scheme
  1. 1 mark

    One square stands for 4 cakes (\(24 \div 6 = 4\)); or the correct answers 14 and 76 with no working

  2. 1 mark

    Wednesday: 14

  3. 1 mark

    Tuesday 18 and Thursday 20, or a correct method to add all four days

    Follow through from their value for one square if it is wrong but used correctly.

  4. 1 mark

    Altogether: 76

    Each answer must be clearly linked to its question, or given in the order asked. A correct answer with no working scores full marks.

Ready to try the rest? Tap your answers and see straight away how you did.

Topic notes

Bar charts and pictograms

The big idea

When you collect information, such as the birds you see in a garden, the numbers you collect are called data. Tally charts, tables, bar charts and pictograms set out data so that it is easy to read and compare. Before you answer a question, always check what each mark, bar or symbol stands for.

Tally charts and tables

A tally chart helps you count as you go. You draw one short line, called a tally mark, for each thing you count. The fifth mark is drawn across the other four. This makes a bundle of 5 that looks like a little gate.

To count tally marks, count the gates in 5s, then add the marks that are on their own. Three gates and 2 single marks show \(5 + 5 + 5 + 2 = 17\).

A table sets out data in rows (going across) and columns (going down). Find the row you need, then move along it to the right column.

Bar charts

In a bar chart, the height of each bar shows a number. The numbers up the side make the scale. Before you read any bar, work out what the scale goes up in. It might count in 2s, 5s or 10s. Some bar charts have bars that go across, with the scale along the bottom. You read them in the same way.

To read a bar, lay a ruler across from its top to the numbers on the scale. If the top of a bar is halfway between two numbered lines, its number is halfway between them too:

  • on a scale that counts in 2s, a bar ending halfway between 6 and 8 shows 7;
  • on a scale that counts in 10s, a bar ending halfway between 30 and 40 shows 35.
Birds seen in the school garden. Bar chart of number of birds for each bird: Robin 9, Pigeon 7, Blue tit 21, Blackbird 18, Sparrow 30.
Class 4 counted the birds in the school garden for one hour. The scale goes up in 2s.

Use the bird chart. How many robins did Class 4 see? Which bird did they see twice as many times as robins?

The scale counts in 2s. The top of the robin bar is halfway between 8 and 10, so they saw 9 robins.

Twice as many as 9 is \(9 \times 2 = 18\). The blackbird bar stops exactly on the 18 line. So they saw twice as many blackbirds as robins.

Pictograms

A pictogram uses symbols (small pictures) to show numbers. The key tells you how many one whole symbol stands for. Keys often use 2, 4, 5 or 10. A piece of a symbol shows part of that number. If one circle stands for 4:

  • half a circle stands for 2, because half of 4 is 2;
  • a quarter of a circle stands for 1;
  • three quarters of a circle stand for 3.

Four friends collected shells on a beach. Use the pictogram to complete the table. How many shells did they collect altogether?

Pictogram titled "Shells collected on the beach", a table with 4 rows of circle symbols. Key: one circle represents 4 shells. Amy: 3 circles = 12 shells. Ben: 1 and a half circles = 6 shells. Cara: 1 and a quarter circles = 5 shells. Dev: 3 and three quarters circles = 15 shells. Total of the rows that are drawn: 38 shells.
One whole circle stands for 4 shells.
  • Amy: 3 circles. \(3 \times 4 = 12\) shells.
  • Ben: 1 circle and half a circle. \(4 + 2 = 6\) shells.
  • Cara: 1 circle and a quarter of a circle. \(4 + 1 = 5\) shells.
  • Dev: 3 circles and three quarters of a circle. \(12 + 3 = 15\) shells.
NameNumber of shells
Amy12
Ben6
Cara5
Dev15

Altogether: \(12 + 6 + 5 + 15 = 38\) shells.

Solving problems with charts

First read the numbers you need. Then decide what to do with them:

  • "altogether" or "in total" means add;
  • "how many more", "how many fewer" or "what is the difference" means subtract: take the smaller number away from the bigger one.

Use the bird chart again. Which two birds together were seen the same number of times as the sparrows?

The sparrow bar stops on the 30 line, so Class 4 saw 30 sparrows. Read the other bars too: robin 9, pigeon 7, blue tit 21 and blackbird 18. Then try pairs:

  • blackbird and robin: \(18 + 9 = 27\). Too small.
  • blackbird and blue tit: \(18 + 21 = 39\). Too big.
  • robin and blue tit: \(9 + 21 = 30\). Just right.

The robins and blue tits together were seen 30 times, the same as the sparrows.

Common mistakes

  • Counting a tally gate as 4. The mark drawn across it is mark number 5, so each gate is 5.
  • Counting the lines on a bar chart in 1s when the scale counts in 2s, 5s or 10s. Always use the numbers on the scale.
  • Counting each symbol in a pictogram as 1. Use the key: if one circle stands for 4, then 3 circles show 12, not 3. Part symbols count too.
  • Adding when the question asks "how many more". "How many more" means subtract.

Top tip

Read the title, the labels and the scale or key first. Then check that your answer makes sense: a taller bar or a longer row should give a bigger number.

Study Helper Hints first, answers after you try

Stuck on this one? Ask for a hint and I’ll point you in the right direction, without giving the answer away. Once you’ve checked your answer, I’ll show you how the marks are awarded.