
Level:
Correct: 0
Incorrect: 0
Marks: 0/0
Exam Practice
Course:
Topics:
OCR GCSE Chemistry (Paper 2) Smart practice A mixed round aimed at your weak spots
Unit 4
Predicting and identifying reactions and products
Unit 5
Monitoring and controlling chemical reactions
Unit 6
Global challenges
Unit 7
Practical skills
Avg
score:
–
Topics
done:
0/34

Life-cycle assessments

Practise 15 exam-style questions on Life-cycle assessments for OCR GCSE Chemistry (Paper 2). Write your answer as you would in the exam and get it marked in seconds against the mark scheme, point by point, with the Study Helper on hand if you get stuck.

  • 15 questions
  • 1–6 marks each
  • Instant marking
  • No sign-up needed
15 questions, marked as you go

Sample questions with model answers

Here are 4 of the questions in this topic, each with a model answer, an explanation of why it earns the marks and the mark scheme an examiner would use.

Question 1

1 mark

A factory makes glass bottles. The factory records four pieces of information for the manufacturing stage of a life-cycle assessment.

Which piece of information is about an impact on the environment rather than about the use of resources?

Choose your answer.

  • A Cooling water used for the moulds
  • B Electricity used to run the machines
  • C Sand used to make the glass
  • D Waste gases from the chimney

Model answer

D - Waste gases from the chimney

Explanation

A life-cycle assessment records two kinds of information at every stage: the resources used (raw materials, water and energy) and the impacts on the environment (such as waste gases, other pollution and waste sent to landfill). Water, electricity and sand are all resources that the factory uses. Only the waste gases are something released into the environment.

Mark scheme
  1. 1 mark

    D / Waste gases from the chimney

    The only correct answer is D: waste gases (such as carbon dioxide) released into the air are pollution, which is an impact on the environment. A is not correct because the cooling water is a resource that the factory uses. B is not correct because electricity is energy, a resource that the factory uses. C is not correct because sand is a raw material, a resource that is used up. ALLOW the letter or the option. If more than one option is given, do not award the mark.
Question 2

2 marks

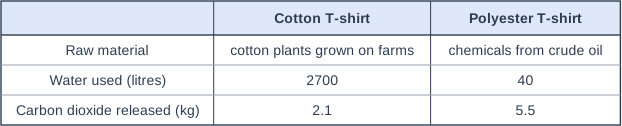
The table shows a scientist's estimates for making one cotton T-shirt and one polyester T-shirt.

Use the table to give one environmental advantage of the cotton T-shirt and one environmental advantage of the polyester T-shirt.

Table with columns (row headings), "Cotton T-shirt", "Polyester T-shirt". Raw material; Cotton T-shirt: cotton plants grown on farms; Polyester T-shirt: chemicals from crude oil | Water used (litres); Cotton T-shirt: 2700; Polyester T-shirt: 40 | Carbon dioxide released (kg); Cotton T-shirt: 2.1; Polyester T-shirt: 5.5.

Model answer

Cotton T-shirt: less carbon dioxide is released in making it (2.1 kg compared with 5.5 kg).
Polyester T-shirt: much less water is used to make it (40 litres compared with 2700 litres).

Explanation

Comparing data from a life-cycle assessment often shows that each product has some advantages. Here cotton releases less carbon dioxide and comes from a renewable resource, but growing cotton needs a very large amount of water. Always quote the numbers from the table when you compare.

Mark scheme
  1. 1 mark

    cotton: less carbon dioxide is released (in making it) (2.1 kg compared with 5.5 kg)

    1 mark for any one of points 1 and 2 (an advantage of the cotton T-shirt), max 1, and 1 mark for point 3 (an advantage of the polyester T-shirt). If more than one answer is given, a wrong one cancels a right one (for each T-shirt). ALLOW less greenhouse gas / less impact on global warming. DO NOT ALLOW 'cotton releases no carbon dioxide'.

  2. 1 mark

    cotton: made from a renewable raw material / cotton plants can be grown again, but crude oil (for polyester) is finite / non-renewable / will run out

    ALLOW does not use up crude oil. IGNORE 'natural' on its own.

  3. 1 mark

    polyester: much less water is used (to make it) (40 litres compared with 2700 litres)

    ALLOW uses less water. IGNORE references to cost, comfort or how long the T-shirt lasts (not in the table).

Question 3

2 marks

A student has two sets of data from a life-cycle assessment of an electric oven.

• Data set 1: the energy used in each stage (raw materials, manufacture, transport, use and disposal).
• Data set 2: the total energy used by the oven at the end of each year for 12 years.

The student wants to show each set of data as a graph.

Name the type of graph that would show each data set best. Give a reason for each choice.

Model answer

Data set 1: a bar chart, because the stages are separate categories, not numbers.
Data set 2: a line graph, because time in years is continuous and both variables are numbers, so the line shows how the total energy changes over time.

Explanation

Choose a bar chart when one variable is made of categories, such as the stages of a life-cycle assessment. Choose a line graph when both variables are numbers that change continuously, such as time and total energy; the gradient of the line then shows the rate at which energy is used each year.

Mark scheme
  1. 1 mark

    data set 1: bar chart, because the stages are categories (categoric data / words, not numbers)

    The type of graph and a reason are both needed for each mark. ALLOW pie chart, because the stages are parts of a whole (categories). ALLOW the stages are separate / not continuous.

  2. 1 mark

    data set 2: line graph, because time (years) is continuous / both variables are numbers (numerical data)

    ALLOW scatter graph (with a line) for line graph. ALLOW to show how the total changes over time / to show the trend. DO NOT ALLOW bar chart for data set 2.

Question 4

4 marks

Over two years, a family's torch would use 60 disposable AA batteries. Instead, the family could use one rechargeable AA battery and recharge it 60 times.

A scientist estimates the carbon dioxide released over the whole life cycle:

• each disposable battery: 100 g (making, transport and disposal)
• the rechargeable battery: 450 g (making, transport and disposal)
• each recharge of the rechargeable battery: 5 g (electricity used).

Calculate the total mass of carbon dioxide released for each choice.

Use your answers to explain which choice is better for the environment.

Model answer

Disposable batteries: 60 × 100 = 6000 g
Rechargeable battery: 450 + (60 × 5) = 450 + 300 = 750 g
The rechargeable battery is better for the environment because it releases 5250 g less carbon dioxide, which is 8 times less than the disposable batteries.

Explanation

For the rechargeable battery, remember to add the carbon dioxide for all 60 recharges to the carbon dioxide for making it. Making a rechargeable battery releases more carbon dioxide than making one disposable battery, but one rechargeable battery replaces 60 disposable ones. Comparing totals over the same job is how a life-cycle assessment compares products fairly.

Mark scheme
  1. 1 mark

    disposable batteries: 60 × 100 = 6000 (g) / 6.0 kg; or a correct final answer of 6000 g (6.0 kg) and 750 g (0.75 kg) with no working

    An answer of 6000 g (6.0 kg) for the disposable batteries and 750 g (0.75 kg) for the rechargeable battery with no working scores marking points 1 to 3 only. Point 4 needs a conclusion. ALLOW values given in kg (6.0 kg and 0.75 kg).

  2. 1 mark

    recharging: 60 × 5 = 300 (g); or a correct final answer of 6000 g (6.0 kg) and 750 g (0.75 kg) with no working

    ALLOW 300 g seen anywhere in the working.

  3. 1 mark

    rechargeable battery: 450 + 300 = 750 (g) / 0.75 kg; or a correct final answer of 6000 g (6.0 kg) and 750 g (0.75 kg) with no working

    ALLOW 450 + 60 × 5 = 750 written as one line for points 2 and 3. ALLOW ECF from a wrong value in point 2 (for example 60 × 50 = 3000, then 450 + 3000 = 3450 g, scores point 3). DO NOT ALLOW 455 g (only one recharge counted) for point 3.

  4. 1 mark

    conclusion: the rechargeable battery is better, because it releases less carbon dioxide (5250 g less / 8 times less)

    ALLOW ECF from the student's own totals if the battery with the smaller total is chosen. ALLOW less waste because only one battery is thrown away (if the carbon dioxide comparison is also given). DO NOT ALLOW a choice with no reason.

Ready to try the rest? Every answer you write is marked against the mark scheme, so you can see exactly where the marks are.

Study Helper Hints first, answers after you try

Stuck on this one? Ask for a hint and I’ll point you in the right direction, without giving the answer away. Once you’ve checked your answer, I’ll show you how the marks are awarded.