Level:
Correct: 0
Incorrect: 0
Marks: 0/0
Exam Practice
Course:
Topics:
OCR GCSE Chemistry (Paper 2) Smart practice A mixed round aimed at your weak spots
Unit 4
Predicting and identifying reactions and products
Unit 5
Monitoring and controlling chemical reactions
Unit 6
Global challenges
Unit 7
Practical skills
Avg
score:
–
Topics
done:
0/34

Interpreting rate of reaction graphs

Practise 15 exam-style questions on Interpreting rate of reaction graphs for OCR GCSE Chemistry (Paper 2). Write your answer as you would in the exam and get it marked in seconds against the mark scheme, point by point, with the Study Helper on hand if you get stuck.

  • 15 questions
  • 1–6 marks each
  • Instant marking
  • No sign-up needed
15 questions, marked as you go

Sample questions with model answers

Here are 4 of the questions in this topic, each with a model answer, an explanation of why it earns the marks and the mark scheme an examiner would use.

Question 1

1 mark

A student measures the total volume of gas given off by a reaction. Her graph of volume against time is a straight line between 10 s and 40 s.

• At 10 s, the volume is 32 cm³.
• At 40 s, the volume is 80 cm³.

What is the rate of reaction between 10 s and 40 s?

Choose your answer.

  • A 0.63 cm³/s
  • B 1.6 cm³/s
  • C 2.0 cm³/s
  • D 3.2 cm³/s

Model answer

B - 1.6 cm³/s

Explanation

The gradient of a graph of volume against time is the rate of reaction. For a straight section, use the change between its two ends: gradient = change in volume ÷ change in time = (80 − 32) ÷ (40 − 10) = 48 ÷ 30 = 1.6 cm³/s. Dividing one reading by its time (80 ÷ 40 or 32 ÷ 10) gives the mean rate from the start, not the rate on this straight section.

Mark scheme
  1. 1 mark

    B / 1.6 cm³/s

    The only correct answer is B: the rate is the gradient of the straight line, change in volume ÷ change in time = (80 − 32) ÷ (40 − 10) = 48 ÷ 30 = 1.6 cm³/s. A is not correct because 0.63 is 30 ÷ 48, the gradient upside down. C is not correct because 2.0 is 80 ÷ 40, the mean rate from 0 s to 40 s, which includes the faster start of the reaction. D is not correct because 3.2 is 32 ÷ 10, the mean rate in the first 10 s only. ALLOW the letter or the option. If more than one option is given, do not award the mark.
Question 2

2 marks

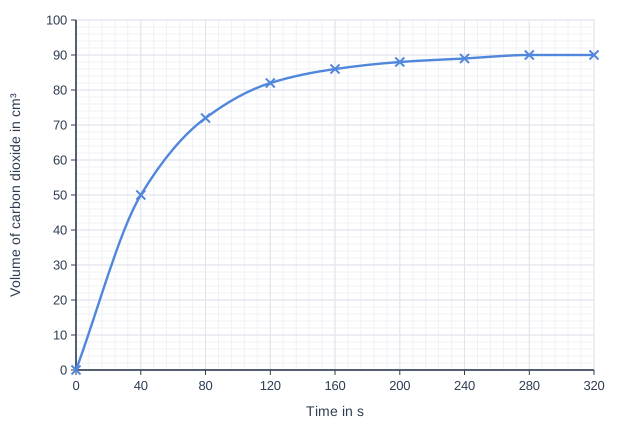
A student adds magnesium carbonate powder to an excess of dilute sulfuric acid. She measures the total volume of carbon dioxide given off.

The graph shows her results.

The student says:
'Three-quarters of the final volume of carbon dioxide had been given off within the first minute.'

Use the graph to decide whether the student is correct. Show how you decide.

Line graph of volume of carbon dioxide in cm³ (y-axis, 0 to 100) against time in s (x-axis, 0 to 320). The line is a smooth curve through (0, 0), (40, 50), (80, 72), (120, 82), (160, 86), (200, 88), (240, 89), (280, 90), (320, 90).

Model answer

From the graph, the volume at 60 s is about 63 cm³.
The final volume is 90 cm³, and three-quarters of 90 cm³ = 67.5 cm³.
63 cm³ is less than 67.5 cm³, so the student is not correct (only about 70% had been given off).

Explanation

First find the final volume, where the curve levels off (90 cm³), and work out three-quarters of it (67.5 cm³). Then read the curve at 60 s, which lies between two plotted points, so draw up from 60 s to the curve and across to the volume axis. The reading (about 63 cm³) is below 67.5 cm³, so the claim is wrong.

Mark scheme
  1. 1 mark

    volume at 60 s read from the graph: any value from 60 to 65 cm³

    A reading from 60 to 65 cm³ with no comparison scores marking point 1 only, and a conclusion ('not correct') with no working scores 0, because the question asks how you decide. For 2 marks the reading must also be compared with three-quarters of the final volume (67.5 cm³, or 75%) to reach the conclusion 'not correct'. ALLOW the reading seen in the working, for example 63 cm³.

  2. 1 mark

    three-quarters of the final volume = 0.75 × 90 = 67.5 cm³, and the volume at 60 s is less than this, so the student is NOT correct

    ALLOW 63 ÷ 90 = 0.70 / 70% (from their reading), which is less than 75%, so the student is not correct. ALLOW ECF: a conclusion that correctly compares their own stated reading at 60 s with 67.5 cm³. The value 67.5 cm³ (or a fraction or percentage from the reading) must be seen.

Question 3

2 marks

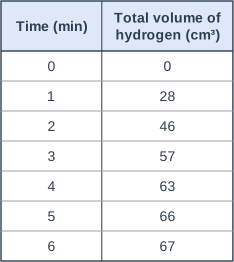
A student adds zinc powder to dilute hydrochloric acid and measures the total volume of hydrogen every minute.

The table shows her results.

The student says:
'The reaction was fastest between 5 and 6 minutes, because that is when the volume of hydrogen was largest.'

Use the results to explain why the student is wrong.

Table with columns "Time (min)", "Total volume of hydrogen (cm³)". Time (min): 0; Total volume of hydrogen (cm³): 0 | Time (min): 1; Total volume of hydrogen (cm³): 28 | Time (min): 2; Total volume of hydrogen (cm³): 46 | Time (min): 3; Total volume of hydrogen (cm³): 57 | Time (min): 4; Total volume of hydrogen (cm³): 63 | Time (min): 5; Total volume of hydrogen (cm³): 66 | Time (min): 6; Total volume of hydrogen (cm³): 67.

Model answer

The rate is how much hydrogen is made each minute, not the total volume. In the first minute the volume went up by 28 cm³, but between 5 and 6 minutes it went up by only 1 cm³ (66 to 67 cm³). So the reaction was fastest at the start and slowest between 5 and 6 minutes.

Explanation

The total volume keeps building up as the reaction goes on, so it is always largest at the end even though the reaction is then nearly over. The rate is the change in volume per unit time, which you find by subtracting one reading from the next. The specification lists misreading rate graphs as a common misconception.

Mark scheme
  1. 1 mark

    the rate is shown by how much the volume increases each minute (the gradient), not by the total volume

    ALLOW rate = volume of gas made in a time ÷ the time / the volume made per minute. IGNORE 'the volume is cumulative' on its own.

  2. 1 mark

    correct use of data: 28 cm³ was given off in the first minute but only 1 cm³ between 5 and 6 minutes, so the reaction was fastest at the start (and slowest at the end)

    ALLOW any correct comparison of volume increases, for example 28 cm³ in the first minute and 3 cm³ between 4 and 5 minutes. The data must show that the increase per minute is largest at the start.

Question 4

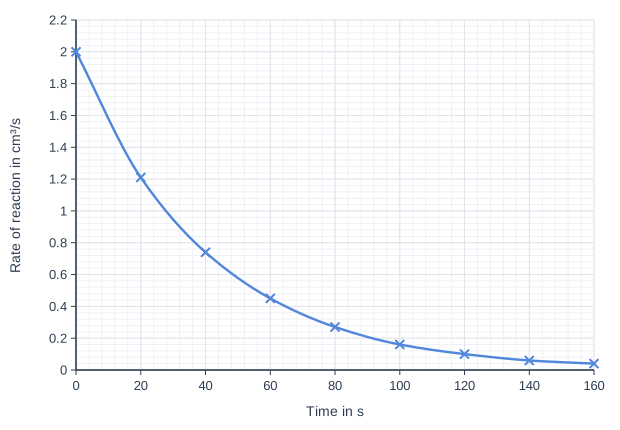
3 marks

A data logger is used to follow the reaction between magnesium powder and an excess of dilute sulfuric acid. A computer works out the rate of reaction every 20 seconds.

The graph shows the rate of reaction against time.

Use the graph to find the time at which the rate had fallen to half of its value at the start.

Describe how the rate of reaction changes during the reaction.

Line graph of rate of reaction in cm³/s (y-axis, 0 to 2.2) against time in s (x-axis, 0 to 160). The line is a smooth curve through (0, 2), (20, 1.21), (40, 0.74), (60, 0.45), (80, 0.27), (100, 0.16), (120, 0.1), (140, 0.06), (160, 0.04).

Model answer

At the start the rate is 2.0 cm³/s, so half of it is 1.0 cm³/s. Reading across from 1.0 cm³/s to the curve and down gives a time of about 28 s.
The rate is greatest at the start and then decreases. It falls quickly at first and then more slowly, getting closer and closer to zero as the reaction finishes.

Explanation

On this graph the y-axis is the rate itself, so a falling line shows the reaction slowing down. To find when the rate had halved, read across from 1.0 cm³/s (half of 2.0 cm³/s) to the curve, then down to the time axis: the value lies between the plotted points at 20 s and 40 s. The rate falls because the acid is being used up.

Mark scheme
  1. 1 mark

    (half of 2.0 cm³/s = 1.0 cm³/s, so the time is) any value from 26 to 30 s

    An answer from 26 to 30 s with no working scores marking point 1 only. DO NOT ALLOW 20 s or 40 s (plotted points, where the rate is not half of the starting value) or 80 s (half of the time axis).

  2. 1 mark

    the rate is greatest at the start and decreases (as the reaction goes on)

    ALLOW the rate falls / goes down all the time. DO NOT ALLOW 'the rate increases'.

  3. 1 mark

    the rate falls quickly at first and then more slowly / it gets closer and closer to zero (as the reaction finishes)

    ALLOW the rate is almost zero by 160 s / the rate levels off near zero. ALLOW the curve gets less steep.

Ready to try the rest? Every answer you write is marked against the mark scheme, so you can see exactly where the marks are.

Study Helper Hints first, answers after you try

Stuck on this one? Ask for a hint and I’ll point you in the right direction, without giving the answer away. Once you’ve checked your answer, I’ll show you how the marks are awarded.