
Level:
Correct: 0
Incorrect: 0
Marks: 0/0
Exam Practice
Course:
Topics:
Edexcel GCSE Chemistry (Paper 2) Smart practice A mixed round aimed at your weak spots
Unit 1
Key concepts in chemistry
Unit 6
Groups in the periodic table
Unit 7
Rates of reaction and energy changes
Unit 8
Fuels and Earth science
Unit 9
Separate chemistry 2
Avg
score:
–
Topics
done:
0/34

Instrumental methods and flame photometry

Practise 12 exam-style questions on Instrumental methods and flame photometry for Edexcel GCSE Chemistry (Paper 2). Write your answer as you would in the exam and get it marked in seconds against the mark scheme, point by point, with the Study Helper on hand if you get stuck.

  • 12 questions
  • 1–6 marks each
  • Instant marking
  • No sign-up needed
12 questions, marked as you go

Sample questions with model answers

Here are 4 of the questions in this topic, each with a model answer, an explanation of why it earns the marks and the mark scheme an examiner would use.

Question 1

1 mark

Which is an advantage of using a flame photometer rather than a flame test to analyse a solution of metal ions?

Choose your answer.

  • A it can also identify halide ions
  • B it measures the concentration of ions
  • C it needs no reference data
  • D it works on undissolved solids

Model answer

B

A flame photometer measures the concentration of the metal ions; a flame test only identifies them.

Explanation

A flame test is qualitative, but a flame photometer gives readings that can be turned into concentrations using a calibration curve, and its data can be compared with reference data to identify metal ions. It works on solutions of metal ions only, so it cannot identify negative ions such as halides.

Mark scheme
  1. 1 mark

    B / it measures the concentration of ions (1)

    The only correct answer is B: a flame photometer, with a calibration curve, gives the concentration of a metal ion in a solution, whereas a flame test only shows which metal ion is present. A is not correct because a flame photometer analyses metal ions, not halide ions; C is not correct because metal ions are identified by comparing the data with reference data; D is not correct because a flame photometer analyses ions in dilute solution. Accept the letter or the option. If more than one option is given, do not award the mark.
Question 2

2 marks

A student uses a flame photometer to measure the concentration of sodium ions in water from a well near the coast. Her standard solutions contain from 0 to 10 mg dm⁻³ of sodium ions, and they give readings from 0 to 85. The undiluted well water gives a reading of 140.

Explain why she cannot use her calibration curve to find the concentration of sodium ions from this reading, and describe what she should do instead.

Model answer

A reading of 140 is higher than the reading for her most concentrated standard (85), so it is outside the range of her calibration curve; she does not know how the curve continues beyond 10 mg dm⁻³, so she cannot read a reliable concentration. She should dilute the well water by a known factor, for example 10.0 cm³ made up to 100 cm³ with distilled water, so that its reading lies within the range of the standards, read the concentration from the curve, and multiply it by the dilution factor (10).

Explanation

A calibration curve is valid only between its lowest and highest standards, because the curve may bend at higher concentrations. Diluting the sample by a known factor brings its reading into the calibrated range, and the result is then multiplied by that factor. Just saying 'dilute it' is not enough without a known dilution.

Mark scheme
  1. 1 mark

    the reading is outside the range of the standards / higher than the reading for the most concentrated standard, so the curve cannot be used (reliably) / the curve may not continue in the same way (1)

    allow 'extending (extrapolating) the curve beyond the standards is unreliable'. Ignore 'the reading is too high' with no reference to the standards or the curve.

  2. 1 mark

    dilute the (well) water by a known factor so that its reading is within the range of the standards, then multiply the concentration from the curve by the dilution factor (1)

    The idea of a known dilution (or of multiplying back) is needed: 'dilute the water' alone does not score. allow 'make standard solutions with higher concentrations so that the reading is within the calibration range'.

Question 3

3 marks

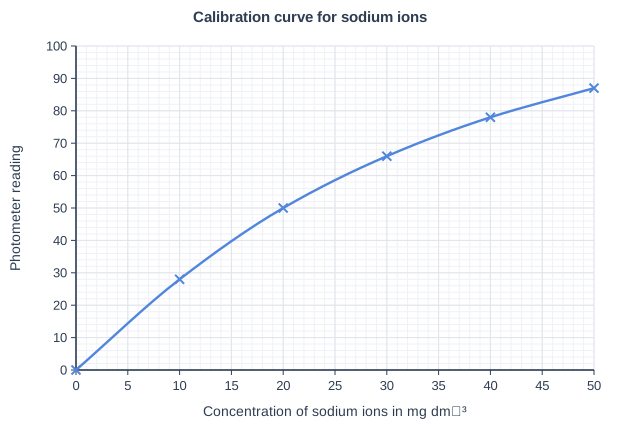
Treated waste water from a sewage works flows into a river. A scientist measures the concentration of sodium ions in river water collected upstream and downstream of the outlet. The graph shows her calibration curve for sodium ions.

upstream sample: reading 40
downstream sample: reading 80

A student says: 'The downstream reading is twice the upstream reading, so the concentration of sodium ions downstream is twice the concentration upstream.'

Use the graph to evaluate the student's statement.

Calibration curve for sodium ions. Line graph of photometer reading (y-axis, 0 to 100) against concentration of sodium ions in mg dm⁻³ (x-axis, 0 to 50). The line is a smooth curve through (0, 0), (10, 28), (20, 50), (30, 66), (40, 78), (50, 87).

Model answer

From the graph, a reading of 40 gives about 15 mg dm⁻³ of sodium ions upstream, and a reading of 80 gives about 42 mg dm⁻³ downstream. 42 ÷ 15 = 2.8, so the downstream concentration is nearly three times the upstream concentration, not twice. The student is wrong because the calibration curve is not a straight line: it gets less steep at higher concentrations, so the reading is not proportional to the concentration.

Explanation

A reading can be converted into a concentration only by using the calibration curve, because the curve is not a straight line through the origin. As the curve flattens at higher concentrations, doubling the reading more than doubles the concentration. Answers that just compare the readings, without reading the concentrations from the graph, cannot evaluate the claim.

Mark scheme
  1. 1 mark

    upstream concentration = 15 mg dm⁻³ (1)

    accept 14 to 16. Mark independently: MP1 and MP2 are for the graph readings, MP3 for the judgement.

  2. 1 mark

    downstream concentration = 42 mg dm⁻³ (1)

    accept 41 to 43

  3. 1 mark

    the downstream concentration is more than twice (about 2.8 times) the upstream concentration, so the statement is wrong, because the calibration curve is not a straight line / the reading is not proportional to the concentration (1)

    allow ECF from their two concentrations if their ratio is more than 2. allow 'the curve gets less steep at higher concentrations, so doubling the reading more than doubles the concentration'. allow 'wrong because the reading is not proportional to the concentration' without the ratio.

Question 4

4 marks

Some hot water from deep underground contains lithium ions. A company tests this water as a possible source of lithium for batteries. It dilutes a sample of the water 50 times and measures the reading of the diluted water with a flame photometer. The reading is 55.

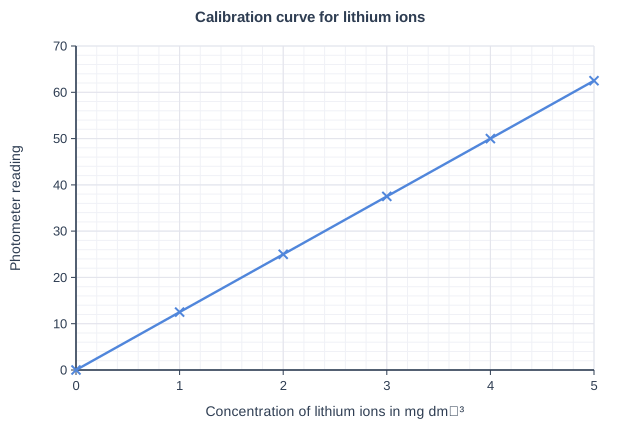
The graph shows the company's calibration curve for lithium ions.

Calculate the maximum mass of lithium carbonate, Li₂CO₃, in kg, that could be made from the lithium ions in 1000 dm³ of the undiluted water.

(relative atomic masses: Li = 7, C = 12, O = 16)

Calibration curve for lithium ions. Line graph of photometer reading (y-axis, 0 to 70) against concentration of lithium ions in mg dm⁻³ (x-axis, 0 to 5). The line joins the points (0, 0), (1, 12.5), (2, 25), (3, 37.5), (4, 50), (5, 62.5).

Model answer

From the graph, a reading of 55 gives 4.4 mg dm⁻³ of lithium ions in the diluted water.
Concentration in the undiluted water = 4.4 × 50 = 220 mg dm⁻³
Mass of lithium in 1000 dm³ = 220 × 1000 = 220 000 mg = 220 g
Moles of lithium = 220 ÷ 7 = 31.4 mol
Each Li₂CO₃ contains 2 lithium ions, so moles of Li₂CO₃ = 31.4 ÷ 2 = 15.7 mol
Mr of Li₂CO₃ = (2 × 7) + 12 + (3 × 16) = 74
Mass of Li₂CO₃ = 15.7 × 74 = 1163 g = 1.16 kg

Explanation

The graph gives the concentration of the diluted water, so multiply by the dilution factor (50) and then by the volume to find the mass of lithium. Each formula unit of lithium carbonate contains two lithium ions, so the moles of lithium carbonate are half the moles of lithium. Common errors are forgetting the dilution factor, forgetting to halve the moles, and mixing up mg, g and kg.

Mark scheme
  1. 1 mark

    (reading from the graph =) 4.4 (mg dm⁻³) (1)

    An answer of 1.16 kg (accept 1.11 to 1.22 kg, or 1160 g) with no working scores 4 marks. Allow ECF throughout. MP1: accept graph readings from 4.2 to 4.6 (one small square).

  2. 1 mark

    (4.4 × 50 = 220 mg dm⁻³, so) mass of lithium in 1000 dm³ = 220 000 mg = 220 (g) (1)

    allow 0.22 kg. allow ECF from their graph reading.

  3. 1 mark

    (moles of Li = 220 ÷ 7 = 31.4 mol, so) moles of Li₂CO₃ = 31.4 ÷ 2 = 15.7 (mol) (1)

    Alternative for MP3: Mr of Li₂CO₃ = 74 and 14 g of lithium gives 74 g of Li₂CO₃, so mass = 220 × 74 ÷ 14. MP3 needs the 2 : 1 ratio of Li to Li₂CO₃; an answer of 2.33 kg (ratio not used) can score MP1, MP2 and MP4 by ECF, but only with working.

  4. 1 mark

    (mass = 15.7 × 74 = 1163 g =) 1.16 (kg) (1)

    accept 1.11 to 1.22 (from graph readings of 4.2 to 4.6), 1.2, or 1160 g. allow ECF from MP3.

Ready to try the rest? Every answer you write is marked against the mark scheme, so you can see exactly where the marks are.

Study Helper Hints first, answers after you try

Stuck on this one? Ask for a hint and I’ll point you in the right direction, without giving the answer away. Once you’ve checked your answer, I’ll show you how the marks are awarded.