
Level:
Correct: 0
Incorrect: 0
Marks: 0/0
Exam Practice
Course:
Topics:
Avg
score:
–
Topics
done:
0/27

Growth, differentiation and percentile charts

Practise 15 exam-style questions on Growth, differentiation and percentile charts for Edexcel GCSE Combined Science (Foundation Biology Paper 1). Write your answer as you would in the exam and get it marked in seconds against the mark scheme, point by point, with the Study Helper on hand if you get stuck.

  • 15 questions
  • 1–6 marks each
  • Instant marking
  • No sign-up needed
15 questions, marked as you go

Sample questions with model answers

Here are 4 of the questions in this topic, each with a model answer, an explanation of why it earns the marks and the mark scheme an examiner would use.

Question 1

1 mark

A bean seed germinates and its root starts to grow. Cells near the tip of the root divide to make new cells. Just behind the tip, these new cells become much longer. This pushes the tip of the root further down into the soil.

Name the process in which the new plant cells become longer.

Model answer

(Cell) elongation.

Explanation

Plants grow by cell division, cell elongation and cell differentiation. Elongation is the process in which a new plant cell becomes longer; in a root or shoot it happens just behind the tip, where the cells have been made by cell division. Animals do not grow by elongation: they grow by cell division and differentiation only.

Mark scheme
  1. 1 mark

    (cell) elongation

    accept elongate / elongated / elongating. accept phonetic spellings. Do not accept growth or 'getting longer' on its own (this repeats the question). Do not accept differentiation, specialisation, cell division or mitosis.
Question 2

2 marks

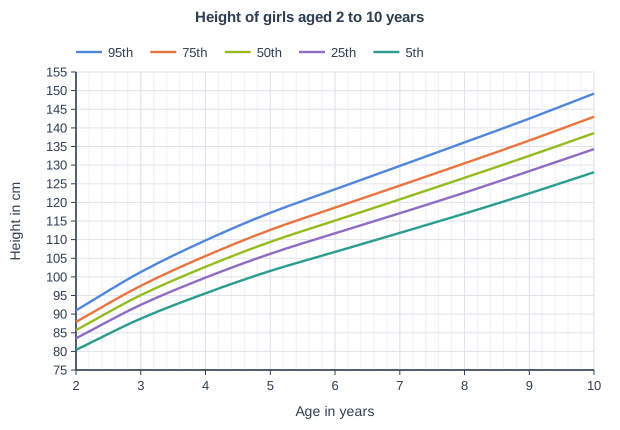
The graph shows a percentile chart for the height of girls aged 2 to 10 years, based on World Health Organization (WHO) data.

Amira is 6 years old. Her height is 115 cm.

Use the graph to give the percentile for Amira's height.

State what this percentile tells you about Amira's height compared with other girls of her age.

Height of girls aged 2 to 10 years. Line graph of height in cm (y-axis, 75 to 155) against age in years (x-axis, 2 to 10). "95th" is a smooth curve through (2, 91), (3, 101.3), (4, 109.8), (5, 117.2), (6, 123.5), (7, 129.8), (8, 136.1), (9, 142.5), (10, 149.2). "75th" is a smooth curve through (2, 87.9), (3, 97.6), (4, 105.6), (5, 112.6), (6, 118.6), (7, 124.5), (8, 130.5), (9, 136.6), (10, 143). "50th" is a smooth curve through (2, 85.7), (3, 95.1), (4, 102.7), (5, 109.4), (6, 115.1), (7, 120.8), (8, 126.6), (9, 132.5), (10, 138.6). "25th" is a smooth curve through (2, 83.5), (3, 92.5), (4, 99.8), (5, 106.2), (6, 111.7), (7, 117.1), (8, 122.6), (9, 128.4), (10, 134.3). "5th" is a smooth curve through (2, 80.4), (3, 88.8), (4, 95.6), (5, 101.6), (6, 106.7), (7, 111.8), (8, 117), (9, 122.4), (10, 128.1).

Model answer

Amira's height is on the 50th percentile.
This means that half (50%) of girls of her age are shorter than her and half are taller, so she is of average height for her age.

Explanation

Go up from 6 years on the x-axis to 115 cm: the point lies on the 50th percentile line. The 50th percentile is the middle value, so 50% of girls of the same age are shorter. A common error is to think a percentile is a percentage above or below the average height.

Mark scheme
  1. 1 mark

    50th (percentile)

    accept 50 / 50th centile. Do not accept a range (for example between the 25th and 75th percentiles).

  2. 1 mark

    half / 50% of girls of her age are shorter than Amira (and half are taller) / she is of average height for her age

    accept 50 out of every 100 girls of her age are shorter / her height is the middle value (median) for girls of her age. allow ecf from an incorrect percentile, for example 75th percentile so 75% of girls of her age are shorter. Ignore 'she is normal' or 'she is healthy' on its own. Do not accept '50% shorter than average' or '50% taller than average'.

Question 3

2 marks

Health visitors measure a baby's mass at several checks during its first year, rather than only once.

Explain why a baby's mass is measured several times.

Model answer

Measuring the mass several times shows how the baby's mass changes over time and whether it stays on the same percentile. If the baby moves to a much lower or higher percentile, a problem can be spotted early, which one measurement on its own could not show.

Explanation

One measurement only shows how a baby compares with other babies of the same age at that moment. Repeated measurements show the pattern of growth: a healthy baby usually follows one percentile line, so moving across lines is a warning sign.

Mark scheme
  1. 1 mark

    to see how the baby's mass changes over time / to see whether the baby stays on (follows) the same percentile

    An explanation linking: monitoring the change (1) and spotting a problem (1). accept to monitor growth (over time) / to check the baby is growing at a steady rate. Ignore 'to see how heavy the baby is' (one measurement shows that).

  2. 1 mark

    so that a problem can be spotted (early) if the baby moves to a different percentile / one measurement cannot show if the baby is growing as expected

    accept so the baby can be treated / helped early if its mass is increasing too slowly or too quickly / if it crosses percentile lines.

Question 4

4 marks

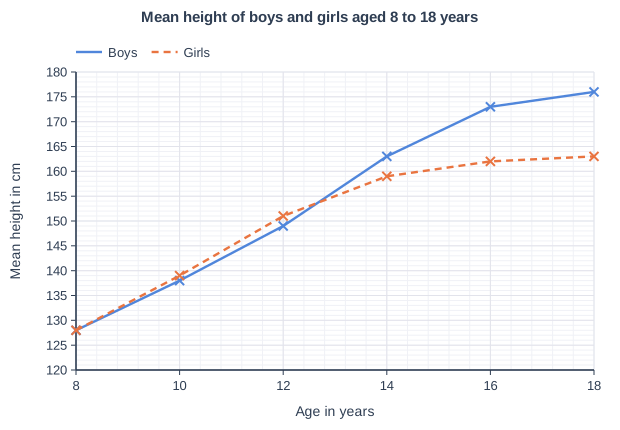
A scientist measured the height of a large group of boys and a large group of girls every two years, from age 8 to age 18.

The graph shows the mean height of each group.

Compare the growth of the boys with the growth of the girls between the ages of 8 and 18 years.

Use data from the graph in your answer.

Mean height of boys and girls aged 8 to 18 years. Line graph of mean height in cm (y-axis, 120 to 180) against age in years (x-axis, 8 to 18). "Boys" joins the points (8, 128), (10, 138), (12, 149), (14, 163), (16, 173), (18, 176). "Girls" (dashed) joins the points (8, 128), (10, 139), (12, 151), (14, 159), (16, 162), (18, 163).

Model answer

Both groups get taller between 8 and 18 years. At 8 years the boys and girls are the same height (128 cm), and they are still about the same at 10 years. Between 10 and 12 years the girls grow faster, so at 12 years the girls are taller (151 cm compared with 149 cm). Between 12 and 16 years the boys grow much faster: they grow 24 cm, but the girls grow only 11 cm. The girls' growth almost stops after 14 years, but the boys are still growing at 18. At 18 the boys are 13 cm taller (176 cm compared with 163 cm).

Explanation

A comparison needs a point about both groups each time, using words such as 'both', 'but' and 'whereas', and the question asks for data, so quote heights or increases from the graph. The key features are that girls have their fastest growth earlier than boys and stop growing sooner, while boys grow for longer and end up taller.

Mark scheme
  1. 1 mark

    both groups get taller / increase in height (from 8 to 18 years)

    A comparison including four from the six points; max 4. Max 3 if no data from the graph are used. Each point must compare boys with girls (stated or clearly implied, for example 'only the boys ...').

  2. 1 mark

    at 8 years (and 10 years) the boys and girls are about the same height

    accept both are 128 cm at 8 years / 138 cm and 139 cm at 10 years.

  3. 1 mark

    the girls are taller than the boys at 12 years / the girls grow faster than the boys between 10 and 12 years

    accept girls 151 cm and boys 149 cm at 12 years / girls grow 12 cm and boys 11 cm between 10 and 12 years.

  4. 1 mark

    the boys grow faster than the girls between 12 and 16 years

    accept boys grow 24 cm and girls grow 11 cm between 12 and 16 years / boys are taller from 14 years (163 cm compared with 159 cm).

  5. 1 mark

    the girls' growth slows down / almost stops after 14 years, but the boys are still growing at 16 to 18 years

    accept girls grow only 1 cm from 16 to 18 years but boys grow 3 cm / girls stop growing earlier than boys.

  6. 1 mark

    the boys are taller than the girls at 18 years / the boys grow more in total

    accept boys 176 cm and girls 163 cm at 18 years / boys are 13 cm taller at 18 / boys grow 48 cm and girls grow 35 cm from 8 to 18 years.

Ready to try the rest? Every answer you write is marked against the mark scheme, so you can see exactly where the marks are.

Study Helper Hints first, answers after you try

Stuck on this one? Ask for a hint and I’ll point you in the right direction, without giving the answer away. Once you’ve checked your answer, I’ll show you how the marks are awarded.