
Level:
Correct: 0
Incorrect: 0
Marks: 0/0
Exam Practice
Course:
Topics:
Avg
score:
–
Topics
done:
0/27

The large data set

Practise 17 exam-style questions on The large data set for Edexcel A-Level Maths (Paper 3). Write your answer as you would in the exam and get it marked in seconds against the mark scheme, point by point, with the Study Helper on hand if you get stuck.

  • 17 questions
  • 3–9 marks each
  • Instant marking
  • No sign-up needed
17 questions, marked as you go

Sample questions with model answers

Here are 4 of the questions in this topic, each with a model answer, an explanation of why it earns the marks and the mark scheme an examiner would use.

Question 1

3 marks

Ravi wants to use the large data set to investigate the relationship between Daily Total Sunshine and the amount of rainfall at Jacksonville.

Explain why Ravi cannot do this.

Name the four quantitative variables that are recorded for Jacksonville in the large data set.

Model answer

Daily Total Sunshine is recorded only at the UK stations, so there are no sunshine data for Jacksonville.
The quantitative variables recorded for Jacksonville are Daily Mean Air Temperature, Rainfall (24 hour total), Daily Mean Pressure and Daily Mean Wind Speed.

Explanation

The overseas stations (Beijing, Jacksonville and Perth) have only five variables: temperature, rainfall, pressure, mean wind speed and its Beaufort conversion, which is a category, not a number. Sunshine, humidity, cloud, visibility, gusts and wind direction are recorded only in the UK. Pearson's examiners have reported students suggesting sunshine or maximum gust as a variable for an overseas station.

Mark scheme
  1. 1 mark

    B1 Daily Total Sunshine is not recorded for Jacksonville (sunshine is recorded only for the UK stations)

    Accept "there is no sunshine data for the overseas stations".

  2. 1 mark

    B1 At least two of: Daily Mean Air Temperature; Rainfall (24 hour total); Daily Mean Pressure; Daily Mean Wind Speed

    Accept short forms such as temperature, rainfall, pressure and wind speed.

  3. 1 mark

    B1 All four (temperature, rainfall, pressure, mean wind speed) and no incorrect variables

    Variables not recorded overseas (sunshine, cloud cover, humidity, visibility, maximum gust, wind direction) are incorrect. The Beaufort conversion is not quantitative: listing it instead of one of the four scores B0 for this mark, but listing it as well as all four can be ignored.
Question 2

4 marks

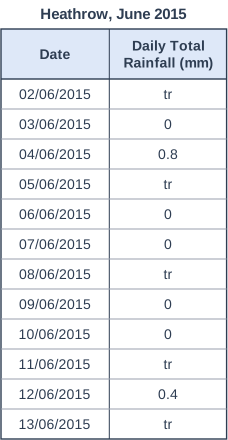
The table shows the Daily Total Rainfall, in mm, at Heathrow from 02/06/2015 to 13/06/2015, taken from the large data set.

A student says that no rain fell on 10 of these days. Explain why the student is wrong, and state the correct number of days with no rain.

Find the median of the Daily Total Rainfall for these 12 days, explaining your answer.

Each tr is now replaced by 0.025 mm. Find the mean of the Daily Total Rainfall for these 12 days.

Heathrow, June 2015. Table with columns "Date", "Daily Total Rainfall (mm)". Date: 02/06/2015; Daily Total Rainfall (mm): tr | Date: 03/06/2015; Daily Total Rainfall (mm): 0 | Date: 04/06/2015; Daily Total Rainfall (mm): 0.8 | Date: 05/06/2015; Daily Total Rainfall (mm): tr | Date: 06/06/2015; Daily Total Rainfall (mm): 0 | Date: 07/06/2015; Daily Total Rainfall (mm): 0 | Date: 08/06/2015; Daily Total Rainfall (mm): tr | Date: 09/06/2015; Daily Total Rainfall (mm): 0 | Date: 10/06/2015; Daily Total Rainfall (mm): 0 | Date: 11/06/2015; Daily Total Rainfall (mm): tr | Date: 12/06/2015; Daily Total Rainfall (mm): 0.4 | Date: 13/06/2015; Daily Total Rainfall (mm): tr.

Model answer

In the large data set tr means a trace of rain, an amount less than 0.05 mm, so some rain did fall on the 5 days recorded as tr. Only the 5 days recorded as 0 (03/06, 06/06, 07/06, 09/06, 10/06) had no rain.
In order: 0, 0, 0, 0, 0, tr, tr, tr, tr, tr, 0.4, 0.8 (each tr is more than 0 and less than 0.05).
There are 12 values, so the median is halfway between the 6th and 7th values, which are both tr: the median is a trace of rain, between 0 and 0.05 mm.
Replacing each tr by 0.025: mean \(= \dfrac{0.8 + 0.4 + 5 \times 0.025}{12} = \dfrac{1.325}{12} = 0.110\) mm (3 s.f.)

Explanation

A trace of rain (tr) is a measured amount below 0.05 mm, so tr days are neither dry days nor missing data. When ordering the values, each tr goes between 0 and the smallest measured amount, which here puts tr values in the middle of the list, so the median is itself a trace. To find a mean, each tr is replaced by a number from 0 to 0.05, here 0.025, and all 12 days stay in the count.

Mark scheme
  1. 1 mark

    B1 The days recorded as tr had a trace of rain (an amount less than 0.05 mm, but not none), so only the 5 days recorded as 0 had no rain

    Needs both the reason (tr is a trace of rain, not zero) and the number 5.

  2. 1 mark

    B1 Orders the values, placing each tr above 0 and below 0.4: 0, 0, 0, 0, 0, tr, tr, tr, tr, tr, 0.4, 0.8

    May be implied by a correct median with a reason.

  3. 1 mark

    B1 The median is the mean of the 6th and 7th values, which are both tr, so the median is a trace of rain: between 0 and 0.05 mm

    Accept 0.025 mm if each tr has been replaced by 0.025, or any stated value from 0 to 0.05 with the matching replacement. A median of 0 because tr was treated as no rain scores B0 unless the replacement value 0 is stated.

  4. 1 mark

    B1 Mean \(= \dfrac{0.8 + 0.4 + 5 \times 0.025}{12} = \dfrac{1.325}{12} =\) awrt 0.110 mm, i.e. in \([0.1095, 0.1105)\)

    \(\dfrac{1.325}{12} = 0.11041...\); accept 0.11. Replacing tr by 0 (giving 0.1), or dividing by 7 (leaving out the 5 days recorded as 0), scores B0.

Question 3

5 marks

Mo uses the large data set to compare the numbers of dry days at Hurn and at Jacksonville from May to October 1987. He counts the days on which the rainfall is recorded as zero:

Hurn: Daily Total Rainfall recorded as 0 on 66 of the 184 days
Jacksonville: Rainfall (24 hour total) recorded as 0.0 on 127 of the 184 days

Mo says that Jacksonville had almost twice as many dry days as Hurn.

Using your knowledge of how rainfall is recorded at the UK and the overseas stations in the large data set, explain why Mo's comparison is not a fair one.

At Hurn, 33 of the 184 days in 1987 are recorded as tr. Use this information to make a fairer comparison of the two stations, giving the proportions that you use to 3 significant figures.

Model answer

At UK stations such as Hurn, an amount of rain less than 0.05 mm is recorded as tr, so Mo's 66 days leave out the 33 days with only a trace of rain.
The overseas stations such as Jacksonville have no tr: rainfall is recorded to the nearest 0.1 mm, so a day with a trace of rain is recorded as 0.0 and is already included in Mo's 127 days.
So Mo is comparing days with no rain at all at Hurn with days with less than 0.05 mm of rain at Jacksonville.
Fairer comparison, using the days with less than 0.05 mm of rain (0 or tr at Hurn, 0.0 at Jacksonville):
Hurn: \(\dfrac{66 + 33}{184} = \dfrac{99}{184} = 0.538\) (3 s.f.)
Jacksonville: \(\dfrac{127}{184} = 0.690\) (3 s.f.)
Jacksonville still had a higher proportion of (almost) dry days, but only about 1.3 times the proportion at Hurn, not almost twice.

Explanation

The large data set uses tr only at the UK stations, for a trace of rain below 0.05 mm; the overseas sheets record rainfall to 0.1 mm with no codes, so 0.0 there covers any amount below 0.05 mm. A fair comparison counts the same kind of day at both stations: 0 or tr at Hurn against 0.0 at Jacksonville. A common error is to treat tr as missing data or to count the tr days as wet days when comparing with an overseas station.

Mark scheme
  1. 1 mark

    B1 At the UK stations an amount of rain less than 0.05 mm is recorded as tr, so Mo's 66 days at Hurn leave out the days with only a trace of rain. Answers of 0.538 and 0.690 with no working score the M1 and A1 marks.

    Answers of 0.538 (Hurn) and 0.690 (Jacksonville) with no working score 2 marks (M1 A1); the explanations and the comparison are marked separately. Must refer to tr (a trace, less than 0.05 mm). "tr means the data are missing" scores B0.

  2. 1 mark

    B1 The overseas stations, such as Jacksonville, do not use tr: rainfall is recorded to the nearest 0.1 mm, so a day with a trace of rain (less than 0.05 mm) is recorded as 0.0 and is already included in Mo's 127 days

    Must say that Jacksonville (or the overseas data) has no tr, with the idea that very small amounts appear as 0.0. Accept "Mo is comparing days with no rain at Hurn with days with less than 0.05 mm at Jacksonville".

  3. 1 mark

    M1 Counts the days with less than 0.05 mm of rain at Hurn (recorded as 0 or tr) and finds a proportion: \(\dfrac{66 + 33}{184}\) \(\left(= \dfrac{99}{184}\right)\)

    Comparing the counts 99 and 127 directly (both out of 184) is also acceptable for this mark.

  4. 1 mark

    A1 Hurn: awrt 0.538, i.e. in [0.5375, 0.5385), and Jacksonville: awrt 0.690, i.e. in [0.6895, 0.6905)

    Both needed. \(\dfrac{99}{184} = 0.53804...\), \(\dfrac{127}{184} = 0.69021...\). Accept 53.8% and 69.0%.

  5. 1 mark

    B1 Jacksonville still had a higher proportion of (almost) dry days than Hurn (0.690 against 0.538), but only about 1.3 times as many, not almost twice as many

    Needs a comparison using the fair proportions (or the counts 127 and 99) that corrects Mo's "almost twice". Ft their proportions.

Question 4

7 marks

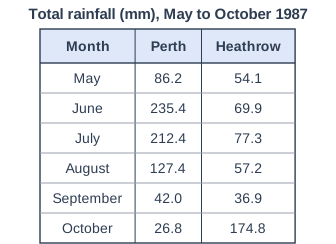
The table shows the total rainfall, in mm, in each month from May to October 1987 at Perth and at Heathrow, taken from the large data set. For Heathrow, each day recorded as tr has been counted as 0.

Find the mean daily rainfall over the 184 days at each station.

Describe one way in which the pattern of monthly rainfall at Perth differs from the pattern at Heathrow, and explain, with reference to the location of Perth, why June and July were its wettest months.

Ama uses the mean daily rainfall for the 184 days at Perth to predict the rainfall at Perth on a day in October 1987. Find the mean daily rainfall at Perth in October 1987, and use it to comment on Ama's method.

Total rainfall (mm), May to October 1987. Table with columns "Month", "Perth", "Heathrow". Month: May; Perth: 86.2; Heathrow: 54.1 | Month: June; Perth: 235.4; Heathrow: 69.9 | Month: July; Perth: 212.4; Heathrow: 77.3 | Month: August; Perth: 127.4; Heathrow: 57.2 | Month: September; Perth: 42.0; Heathrow: 36.9 | Month: October; Perth: 26.8; Heathrow: 174.8.

Model answer

Perth: total \(= 86.2 + 235.4 + 212.4 + 127.4 + 42.0 + 26.8 = 730.2\) mm, mean daily rainfall \(= \dfrac{730.2}{184} = 3.97\) mm (3 s.f.)
Heathrow: total \(= 54.1 + 69.9 + 77.3 + 57.2 + 36.9 + 174.8 = 470.2\) mm, mean daily rainfall \(= \dfrac{470.2}{184} = 2.56\) mm (3 s.f.)
Perth's rainfall was highest in June and July and fell to its lowest in October, whereas Heathrow's totals were similar from May to September and highest by far in October: October was Perth's driest month but Heathrow's wettest.
Perth is in the southern hemisphere, so June and July are its winter, the wet season.
Perth, October 1987: \(\dfrac{26.8}{31} = 0.865\) mm per day (3 s.f.)
Ama's prediction of about 3.97 mm is far too high for October: October's mean daily rainfall is less than a quarter of the 184-day mean. The rainfall at Perth changes with the season (October is spring there, much drier than winter), so a mean over all 184 days does not represent October, and she should use the October data instead.

Explanation

The mean daily rainfall over the period is the six-month total divided by the 184 days. Perth is the only southern-hemisphere station, so May to October runs from late autumn through winter to spring there, and its wettest months are the winter months June and July, while Heathrow's wettest month in 1987 was October. A mean over all 184 days hides this seasonal pattern, so it predicts a dry month such as October at Perth badly; a common error is to divide October's total by 30.

Mark scheme
  1. 1 mark

    M1 Adds the six monthly totals for at least one station and divides by 184: \(\dfrac{730.2}{184}\) or \(\dfrac{470.2}{184}\); or correct final answers of 3.97 mm, 2.56 mm and 0.865 mm with no working

    Answers of 3.97 mm and 2.56 mm (the 184-day means) and 0.865 mm (October at Perth) with no working score 4 marks (M1 A1 M1 A1); the description, explanation and comment are marked separately. Dividing a total by 6 (the mean monthly total) scores M0.

  2. 1 mark

    A1 Perth: awrt 3.97 mm, i.e. in [3.965, 3.975), and Heathrow: awrt 2.56 mm, i.e. in [2.555, 2.565)

    Both needed. \(\dfrac{730.2}{184} = 3.968...\), \(\dfrac{470.2}{184} = 2.555...\)

  3. 1 mark

    B1 A difference in pattern, e.g. Perth's rainfall was highest in June and July and fell to its lowest in October, whereas Heathrow had similar totals from May to September and by far its highest total in October / October was Perth's driest month but Heathrow's wettest

    Must describe the patterns (which months were wettest or driest, or how the totals changed), not just the overall amounts. "Perth had more rain" on its own scores B0.

  4. 1 mark

    B1 Perth is in the southern hemisphere, so June and July are winter there (its wet season)

    Must mention the southern hemisphere (or that Perth is south of the equator) and winter.

  5. 1 mark

    M1 \(\dfrac{26.8}{31}\)

    Dividing by 30 scores M0.

  6. 1 mark

    A1 awrt 0.865 mm, i.e. in [0.8645, 0.8655)

    \(\dfrac{26.8}{31} = 0.86451...\). Accept 0.86 or 0.9 only if a more accurate value has been seen.

  7. 1 mark

    B1 Ama's method is poor: her prediction (about 3.97 mm) is far too high for October, whose mean daily rainfall (0.865 mm) is less than a quarter of the 184-day mean, because Perth's rainfall changes with the season (October is spring there, much drier than winter); she should use the October data

    Must compare their October mean with the 184-day mean (too high, or not representative of October) and give a reason about the seasonal pattern. Ft their means.

Ready to try the rest? Every answer you write is marked against the mark scheme, so you can see exactly where the marks are.

Study Helper Hints first, answers after you try

Stuck on this one? Ask for a hint and I’ll point you in the right direction, without giving the answer away. Once you’ve checked your answer, I’ll show you how the marks are awarded.