
Level:
Correct: 0
Incorrect: 0
Marks: 0/0
Exam Practice
Course:
Topics:
Avg
score:
–
Topics
done:
0/27

Correlation and regression

Practise 17 exam-style questions on Correlation and regression for Edexcel A-Level Maths (Paper 3). Write your answer as you would in the exam and get it marked in seconds against the mark scheme, point by point, with the Study Helper on hand if you get stuck.

  • 17 questions
  • 2–9 marks each
  • Instant marking
  • No sign-up needed
17 questions, marked as you go

Sample questions with model answers

Here are 4 of the questions in this topic, each with a model answer, an explanation of why it earns the marks and the mark scheme an examiner would use.

Question 1

2 marks

A coach recorded the standing long jump distance, \(x\) cm, and the 30 m sprint time, \(y\) seconds, of 8 athletes in a training group. The table shows the results.

Use your calculator to find the product moment correlation coefficient between \(x\) and \(y\), and interpret this value in the context of the question.
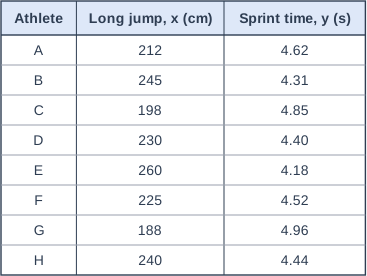
Table with columns "Athlete", "Long jump, x (cm)", "Sprint time, y (s)". Athlete: A; Long jump, x (cm): 212; Sprint time, y (s): 4.62 | Athlete: B; Long jump, x (cm): 245; Sprint time, y (s): 4.31 | Athlete: C; Long jump, x (cm): 198; Sprint time, y (s): 4.85 | Athlete: D; Long jump, x (cm): 230; Sprint time, y (s): 4.40 | Athlete: E; Long jump, x (cm): 260; Sprint time, y (s): 4.18 | Athlete: F; Long jump, x (cm): 225; Sprint time, y (s): 4.52 | Athlete: G; Long jump, x (cm): 188; Sprint time, y (s): 4.96 | Athlete: H; Long jump, x (cm): 240; Sprint time, y (s): 4.44.

Model answer

From a calculator, \(r = -0.984\) (3 s.f.).
This is strong negative correlation: the athletes who jumped further tended to have lower 30 m sprint times, i.e. they tended to be faster sprinters.

Explanation

Enter the 8 pairs of values into the calculator's two-variable statistics mode to obtain r, keeping the minus sign. "Interpret" means the answer must be in context, linking long jump distance with sprint time; a bare "negative correlation" does not earn the second mark. Note that a lower sprint time means a faster athlete.

Mark scheme
  1. 1 mark

    B1 \(r = -0.984\) (awrt \(-0.984\), i.e. in \((-0.9845, -0.9835]\); \(r = -0.98352...\))

    No working is needed: the value comes from a calculator. 0.984 without the minus sign scores B0 (losing the sign is a common error). Allow more accurate values such as -0.9835 or -0.98352.

  2. 1 mark

    B1 Interpretation in context: athletes who jump further tend to have shorter (faster) sprint times

    Must refer to both jump distance and sprint time (or speed). Accept "the longer the jump, the lower the sprint time tends to be" or "there is a strong negative correlation between long jump distance and sprint time". "Strong negative correlation" with no context scores B0, because the question asks for an interpretation. Ignore extra comments that do not contradict.

Question 2

4 marks

Jamal is studying the Daily Maximum Relative Humidity, \(h\) %, and the Daily Total Sunshine, \(s\) hours, at Camborne in 1987, from the large data set. He can only use 171 of the 184 days. On these 171 days the values of \(h\) range from 69 to 100, and the equation of the regression line of \(s\) on \(h\) is
\[s = 39.3 - 0.361h\]
Interpret the gradient of the regression line in context.

Using what you know about the large data set, suggest why Jamal can only use 171 of the 184 days.

Explain why Jamal should not use this line to estimate the Daily Maximum Relative Humidity on a day with 12 hours of sunshine, and why he should not use it to estimate the sunshine on a day with a Daily Maximum Relative Humidity of 60%.

Model answer

Gradient: on average, each 1% increase in the Daily Maximum Relative Humidity is associated with about 0.361 hours (about 22 minutes) less sunshine.
In 1987 some sunshine values at Camborne are recorded as n/a (not available), at the start of May, so those days cannot be used.
The line is the regression line of \(s\) on \(h\), so it should only be used to estimate \(s\) from a given value of \(h\), not \(h\) from \(s\).
A humidity of 60% is outside the range of the data (69% to 100%), so using the line there would be extrapolation.

Explanation

In the large data set, missing values are shown as n/a; at the UK stations in 1987 the sunshine is not available for the first part of May, so those days drop out of any analysis of sunshine. A regression line of s on h predicts the response s from the explanatory variable h, and only within the observed range of h. Using it backwards, or for h = 60, are both misuses.

Mark scheme
  1. 1 mark

    B1 For each increase of 1 (percentage point) in the Daily Maximum Relative Humidity, the Daily Total Sunshine decreases by about 0.361 hours (about 22 minutes) on average

    Must be in context with both variables and the rate. Accept "s falls by 0.361 hours for every 1% increase in h". "Negative correlation" alone scores B0.

  2. 1 mark

    B1 Some of the Daily Total Sunshine values are not available (recorded as n/a) in the data set (on 13 days, at the start of May 1987)

    Must refer to missing or not available data, or n/a. Condone not naming the variable. Do not accept "tr" (trace is used only for rainfall), "outliers were removed" or "he took a sample".

  3. 1 mark

    B1 This is the regression line of \(s\) on \(h\): it is for estimating \(s\) from \(h\) (\(h\) is the explanatory variable), so it should not be used to estimate \(h\) from a value of \(s\)

    Accept "the line predicts sunshine from humidity, not humidity from sunshine" or "you would need the regression line of h on s".

  4. 1 mark

    B1 60% is outside the range of the values of \(h\) in the data (69 to 100), so this would be extrapolation (unreliable)

    Must refer to 60 being outside the range of h, or extrapolation.

Question 3

5 marks

An estate agent recorded the floor area, \(A\) m\(^2\), and the selling price, \(P\) thousand pounds, of 24 houses sold in 2024 in a UK town. The floor areas ranged from 55 m\(^2\) to 140 m\(^2\). The equation of the regression line of \(P\) on \(A\) is
\[P = 38.5 + 2.62A\]
Interpret the gradient of the regression line in context.

A house in the town with a floor area of 96 m\(^2\) is advertised for £335 000. Use the regression line to comment on this price.

Ben owns an 80 m\(^2\) house in the town. He says:
"If I build a 20 m\(^2\) extension, my house will be worth about £52 400 more."

Comment on Ben's statement.

Model answer

Gradient: for each extra square metre of floor area, the selling price increases by about £2620 on average.
For \(A = 96\): \(P = 38.5 + 2.62 \times 96 = 290.02\), about £290 000.
The advertised price, £335 000, is about £45 000 more than predicted, so the house may be overpriced, unless it has other features (such as its location or garden) that make it worth more.
Ben: \(2.62 \times 20 = 52.4\), so the line does give an average increase of about £52 400 for 20 m\(^2\), and 80 m\(^2\) and 100 m\(^2\) are within the range of the data.
However, the line describes an association between floor area and price for the houses sold; it does not show that building an extension will cause the value to rise by this amount. Other factors, such as the quality of the extension, also matter, so this is only a rough estimate.

Explanation

The gradient gives the average change in price per square metre, so it must be stated with units (pounds per square metre). Comparing an actual price with the predicted value shows whether it is high or low for its size. A regression line describes an association in the data, so using it to predict the effect of changing a house assumes a causal link that the data cannot prove.

Mark scheme
  1. 1 mark

    B1 For each extra 1 m\(^2\) of floor area, the selling price increases by about £2620 (2.62 thousand pounds) on average

    Must be in context with the rate and correct units: accept "£2620 per square metre" or "2.62 thousand pounds per m\(^2\)". "The price increases by 2.62" with no units, or "positive correlation", scores B0.

  2. 1 mark

    B1 Predicted price \(= 38.5 + 2.62 \times 96 = 290.02\), i.e. about £290 000

    Accept 290 (thousand pounds) or £290 020.

  3. 1 mark

    B1 The advertised price is about £45 000 more than the line predicts, so the house may be overpriced (or it may have features not explained by floor area, e.g. location, garden or condition)

    Needs a comparison with the predicted price and a sensible conclusion. Allow ft their predicted price.

  4. 1 mark

    B1 \(20 \times 2.62 = 52.4\), so £52 400 is the average increase in price for 20 m\(^2\) given by the line (and 100 m\(^2\) is within the range of the data)

    Accept a calculation of \(2.62 \times 100 - 2.62 \times 80\) or of both predicted prices (248.1 and 300.5, a difference of 52.4).

  5. 1 mark

    B1 But the line only shows an association between floor area and price for houses sold in the town: it does not show that adding 20 m\(^2\) will cause this increase, as other factors (e.g. the quality of the extension, the location, the garden) also affect the price, so £52 400 is only a rough estimate

    Accept "correlation does not imply causation" applied to the extension, or "other factors affect the value of a house". A comment that Ben is simply right scores B0.

Question 4

6 marks

A geography student collected 24 pebbles from one beach. For each pebble she measured its length, \(L\) cm, and its mass, \(m\) grams. The lengths ranged from 2.5 cm to 8.0 cm.

She suggests that the relationship between \(m\) and \(L\) can be modelled by an equation of the form \(m = aL^n\), where \(a\) and \(n\) are constants. The equation of the regression line of \(\log_{10} m\) on \(\log_{10} L\) for her data is
\[\log_{10} m = -0.370 + 3.05\log_{10} L\]
Find the value of \(n\) and the value of \(a\) given by this regression line, giving \(a\) to 3 significant figures.

Pebbles \(P\) and \(Q\) are from the same beach, and their lengths are within the range of the student's data. Pebble \(Q\) is twice as long as pebble \(P\). Using the model, find the ratio of the predicted mass of \(Q\) to the predicted mass of \(P\), giving your answer to 3 significant figures.

The student says that the value of \(n\) suggests that the pebbles on this beach have similar shapes. Explain why.

Model answer

Taking logarithms of \(m = aL^n\): \(\log_{10} m = \log_{10} a + n\log_{10} L\)
Comparing with \(\log_{10} m = -0.370 + 3.05\log_{10} L\):
\(n = 3.05\)
\(\log_{10} a = -0.370\), so \(a = 10^{-0.370} = 0.427\) (3 s.f.)
Ratio of predicted masses: \(\dfrac{m_Q}{m_P} = \dfrac{a(2L)^{3.05}}{aL^{3.05}} = 2^{3.05} = 8.28\) (3 s.f.)
So pebble \(Q\) is predicted to be about 8.28 times as heavy as pebble \(P\).
If the pebbles all have the same shape (each is an enlargement of the others) and are made of the same rock, the volume of a pebble, and so its mass, is proportional to the cube of its length, which gives \(n = 3\). The value \(n = 3.05\) is close to 3, so the data are consistent with the pebbles having similar shapes.

Explanation

Taking logarithms of \(m = aL^n\) gives \(\log_{10} m = \log_{10} a + n\log_{10} L\), so the gradient of the regression line is n and the intercept is \(\log_{10} a\), giving \(a = 10^{-0.370} = 0.427\). Doubling the length multiplies the predicted mass by \(2^n\) whatever the length, because a cancels. A common error is to give a = -0.370, forgetting to undo the logarithm; for the last part, the key idea is that the mass of objects of the same shape and material is proportional to the cube of their length.

Mark scheme
  1. 1 mark

    M1 Compares the line with \(\log_{10} m = \log_{10} a + n\log_{10} L\) (from taking logarithms of \(m = aL^n\)) to get \(\log_{10} a = -0.370\), so \(a = 10^{-0.370}\); or correct final answers of \(n = 3.05\), \(a = 0.427\) and a ratio of 8.28 with no working

    Answers of \(n = 3.05\), \(a = 0.427\) and a ratio of 8.28 with no working score 5 marks; the explanation is marked separately (accept awrt 0.427, i.e. in [0.4265, 0.4275), and awrt 8.28, i.e. in [8.275, 8.285)). \(a = -0.370\) (the intercept itself) scores M0 A0. Condone a missing base 10 in the working.

  2. 1 mark

    A1 \(a = \) awrt 0.427, i.e. in \([0.4265, 0.4275)\)

    \(10^{-0.37} = 0.42657...\). \(10^{-0.37}\) left unevaluated scores A0, because the question asks for 3 significant figures.

  3. 1 mark

    B1 \(n = 3.05\)

    cao: the gradient of the line. Independent of the other marks.

  4. 1 mark

    M1 Forms the ratio of the predicted masses: \(\dfrac{a(2L)^n}{aL^n} = 2^n\), or uses the line: \(\log_{10} m_Q - \log_{10} m_P = n\log_{10} 2\)

    Allow ft their n. Alternative method: predicted masses for a chosen length and twice that length (e.g. 3 cm and 6 cm, giving 12.2 g and 100.8 g) and their ratio: M1.

  5. 1 mark

    A1 \(2^{3.05} = \) awrt 8.28, i.e. in \([8.275, 8.285)\)

    \(2^{3.05} = 8.2821...\): pebble Q is predicted to be about 8.28 times as heavy as P. Accept 8.3 only if 8.28 or better has been seen.

  6. 1 mark

    B1 If the pebbles are all the same shape (each an enlargement of the others) and of the same rock, a pebble's volume, and so its mass, is proportional to \(L^3\), which would give \(n = 3\); \(n = 3.05\) is close to 3, so this supports the pebbles having similar shapes

    Needs the link between n being close to 3 and the mass (or volume) of objects of the same shape being proportional to the cube of the length. Accept "mass is proportional to length cubed for scaled copies of the same shape". "n is close to 3" with no reason scores B0. Comments about the strength of the correlation score B0.

Ready to try the rest? Every answer you write is marked against the mark scheme, so you can see exactly where the marks are.

Study Helper Hints first, answers after you try

Stuck on this one? Ask for a hint and I’ll point you in the right direction, without giving the answer away. Once you’ve checked your answer, I’ll show you how the marks are awarded.