
Level:
Correct: 0
Incorrect: 0
Marks: 0/0
Exam Practice
Course:
Topics:
Avg
score:
–
Topics
done:
0/27

Hypothesis tests for correlation

Practise 16 exam-style questions on Hypothesis tests for correlation for Edexcel A-Level Maths (Paper 3). Write your answer as you would in the exam and get it marked in seconds against the mark scheme, point by point, with the Study Helper on hand if you get stuck.

  • 16 questions
  • 3–9 marks each
  • Instant marking
  • No sign-up needed
16 questions, marked as you go

Sample questions with model answers

Here are 4 of the questions in this topic, each with a model answer, an explanation of why it earns the marks and the mark scheme an examiner would use.

Question 1

3 marks

A sports scientist records, for a random sample of 45 university hockey players, the number of hours of sleep, \(h\), that each player had the night before a training session and their mean reaction time, \(t\) milliseconds, in a test at the start of the session. She believes that players who sleep for longer tend to have shorter reaction times.

The product moment correlation coefficient between \(h\) and \(t\) is \(-0.284\). Her software gives a p-value of 0.0293 for a one-tailed test of whether the population correlation coefficient is 0

State suitable hypotheses for a test of the scientist's belief, and use the p-value to complete the test at the 5% level of significance.

Explain what the p-value of 0.0293 means in this context.

Model answer

\(H_0: \rho = 0\), \(H_1: \rho < 0\)
p-value \(= 0.0293 < 0.05\), so the result is significant and \(H_0\) is rejected.
There is evidence at the 5% level to support the scientist's belief that players who sleep for longer tend to have shorter reaction times.
The p-value means that, if there were no correlation between hours of sleep and reaction time in the population (\(\rho = 0\)), the probability that a sample of 45 players would give a correlation coefficient of −0.284 or lower is 0.0293

Explanation

The belief describes a negative correlation, so \(H_1: \rho < 0\) and the one-tailed p-value is compared directly with 5%. A p-value below the significance level means that a value of r this low would be unlikely if \(\rho = 0\), so \(H_0\) is rejected. Examiners report that very few students interpret a p-value correctly: it is a probability worked out assuming \(H_0\) is true, not the probability that \(H_0\) is true.

Mark scheme
  1. 1 mark

    B1 Both hypotheses: \(H_0: \rho = 0\) and \(H_1: \rho < 0\)

    Must be in terms of \(\rho\) (condone a symbol that looks like p) and attached to \(H_0\) and \(H_1\). \(H_1: \rho > 0\) or \(\rho ≠ 0\) is B0. Do not accept \(H_0: \rho = -0.284\) (a common error: the null hypothesis is always \(\rho = 0\)), or hypotheses in terms of r.

  2. 1 mark

    B1 0.0293 < 0.05, so the result is significant: there is evidence at the 5% level to support the scientist's belief that players who sleep for longer tend to have shorter reaction times (a negative correlation between hours of sleep and reaction time)

    This mark does not depend on the hypotheses. If a comparison is given it must be 0.0293 < 0.05 (comparing −0.284 with 0.05 is B0). Must be in words and mention the scientist's belief, or negative correlation with both variables (sleep and reaction time). Contradictory statements score B0. Ignore extra statements that do not contradict the conclusion.

  3. 1 mark

    B1 The p-value is the probability of a sample of 45 players giving a correlation coefficient of −0.284 or lower (as extreme as, or more extreme than, the value found) if there is no correlation between hours of sleep and reaction time in the population (\(\rho = 0\))

    Needs both ideas: −0.284 or less ("at least as extreme") and "if \(H_0\) is true / if \(\rho = 0\)". B0 for "the probability that \(H_0\) is true", "the probability that there is no correlation" or "the probability that r = −0.284".
Question 2

4 marks

Priya investigates whether there is a positive correlation between the rainfall in May and the mass of hay harvested per hectare in June on farms in one region. For a random sample of 15 farms she finds that the product moment correlation coefficient is 0.462. Her test, at the 5% level of significance, is shown below.

\(H_0: r = 0\), \(H_1: r > 0\)
Critical value 0.5140
\(0.462 < 0.5140\), so accept \(H_0\). There is no correlation between rainfall in May and the mass of hay harvested.

Identify two errors in Priya's working, and complete the test correctly, giving your conclusion in context.

[One-tailed critical values of the PMCC: \(n = 15\); significance level 10%: 0.3507, 5%: 0.4409, 2.5%: 0.5140, 1%: 0.5923, 0.5%: 0.6411]

Model answer

Error 1: the hypotheses should be about the population correlation coefficient: \(H_0: \rho = 0\), \(H_1: \rho > 0\)
Error 2: 0.5140 is the critical value for a one-tailed 2.5% test; for a one-tailed 5% test with \(n = 15\) the critical value is 0.4409
(Also, "there is no correlation" is too definite a conclusion.)
Correct test: \(0.462 > 0.4409\), so the result is significant and \(H_0\) is rejected.
There is evidence at the 5% level of a positive correlation between the rainfall in May and the mass of hay harvested per hectare.

Explanation

Hypotheses are always about the population parameter \(\rho\), because r is the known sample value. The table gives one-tailed critical values, so a one-tailed 5% test uses the 5% column (0.4409), and 0.462 exceeds it, which reverses Priya's decision. Her conclusion was also worded too definitely: a non-significant result only means there is insufficient evidence of correlation.

Mark scheme
  1. 2 marks

    B2 Any two of: (1) the hypotheses should be in terms of the population correlation coefficient \(\rho\), not the sample value r; (2) 0.5140 is the critical value for a one-tailed test at 2.5% (or a two-tailed test at 5%), but her test is one-tailed at 5%, so the critical value is 0.4409; (3) the conclusion "there is no correlation" is too definite: a test can only say whether there is sufficient evidence. 1 mark for each different error, max 2. A correct conclusion with no working scores 0 marks.

    An answer of "there is evidence of positive correlation between May rainfall and hay yield" with no working scores 0 marks: the errors must be identified and the correct critical value used. For error (2), accept "she used the wrong critical value" only if 0.4409 or the correct column (5%) is given. Ignore further correct comments; an incorrect "error" (e.g. "\(H_1\) should be \(\rho ≠ 0\)") does not score.

  2. 1 mark

    M1 Compares 0.462 with the correct critical value 0.4409

    Allow 0.462 > 0.4409 seen, or 0.4409 stated with a correct decision.

  3. 1 mark

    A1 0.462 > 0.4409, so reject \(H_0\): there is evidence at the 5% level of a positive correlation between the rainfall in May and the mass of hay harvested per hectare

    Depends on the M1. Must mention positive correlation and both variables in context (May rainfall and hay mass or yield). Contradictory statements score A0.

Question 3

5 marks

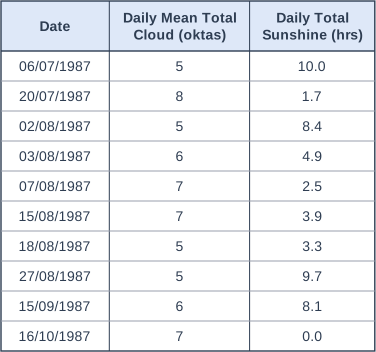
Kamal uses the large data set to investigate whether, at Leuchars in 1987, days with more cloud tend to have less sunshine. He takes a random sample of 10 days, all on or after 18/05/1987. His data, taken from the large data set, are shown in the table.

Find the product moment correlation coefficient between Daily Mean Total Cloud and Daily Total Sunshine for Kamal's sample, giving your answer to 3 significant figures.

Test, at the 1% level of significance, whether there is evidence that Daily Mean Total Cloud and Daily Total Sunshine at Leuchars are negatively correlated. State your hypotheses clearly and the critical value used.

Using what you know about the large data set, explain why Kamal did not take any days before 18/05/1987 for his sample.

[One-tailed critical values of the PMCC: \(n = 10\); significance level 10%: 0.4428, 5%: 0.5494, 2.5%: 0.6319, 1%: 0.7155, 0.5%: 0.7646]

Table with columns "Date", "Daily Mean Total Cloud (oktas)", "Daily Total Sunshine (hrs)". Date: 06/07/1987; Daily Mean Total Cloud (oktas): 5; Daily Total Sunshine (hrs): 10.0 | Date: 20/07/1987; Daily Mean Total Cloud (oktas): 8; Daily Total Sunshine (hrs): 1.7 | Date: 02/08/1987; Daily Mean Total Cloud (oktas): 5; Daily Total Sunshine (hrs): 8.4 | Date: 03/08/1987; Daily Mean Total Cloud (oktas): 6; Daily Total Sunshine (hrs): 4.9 | Date: 07/08/1987; Daily Mean Total Cloud (oktas): 7; Daily Total Sunshine (hrs): 2.5 | Date: 15/08/1987; Daily Mean Total Cloud (oktas): 7; Daily Total Sunshine (hrs): 3.9 | Date: 18/08/1987; Daily Mean Total Cloud (oktas): 5; Daily Total Sunshine (hrs): 3.3 | Date: 27/08/1987; Daily Mean Total Cloud (oktas): 5; Daily Total Sunshine (hrs): 9.7 | Date: 15/09/1987; Daily Mean Total Cloud (oktas): 6; Daily Total Sunshine (hrs): 8.1 | Date: 16/10/1987; Daily Mean Total Cloud (oktas): 7; Daily Total Sunshine (hrs): 0.0.

Model answer

Using a calculator, \(r = -0.762\) (3 s.f.)
\(H_0: \rho = 0\), \(H_1: \rho < 0\)
Critical value (\(n = 10\), 1% level, one-tailed): \(-0.7155\)
\(-0.762 < -0.7155\), so the result is significant and \(H_0\) is rejected.
There is evidence at the 1% level of a negative correlation between Daily Mean Total Cloud and Daily Total Sunshine at Leuchars: days with more cloud tend to have less sunshine.
In the large data set the Daily Total Sunshine at Leuchars is recorded as n/a for every day in May 1987 before 18/05/1987, so those days have no sunshine value and could not be used.

Explanation

Enter the 10 pairs into a calculator to get r, and compare it with the 1% column for \(n = 10\), because the test is one-tailed at 1%: \(-0.762\) is below \(-0.7155\), so the result is significant. In 1987 the large data set has no sunshine values (n/a) for the UK stations at the start of May, which is why the sample starts on 18/05/1987. Students lose marks for conclusions with no context and for reasons that are about the weather rather than the data.

Mark scheme
  1. 1 mark

    B1 \(r = -0.762\) (awrt −0.762, i.e. in [−0.7625, −0.7615)); a correct value of r with no working scores this mark

    An answer of r = −0.762 with no working scores 1 mark (r is found on a calculator). The test needs the hypotheses and the critical value for its marks. Accept the same value if the variables are entered the other way round (r is symmetric).

  2. 1 mark

    B1 Both hypotheses: \(H_0: \rho = 0\) and \(H_1: \rho < 0\)

    Must be in terms of \(\rho\), attached to \(H_0\) and \(H_1\). Hypotheses in terms of r, or two-tailed hypotheses, score B0.

  3. 1 mark

    M1 Critical value −0.7155 (the 1% column for \(n = 10\)), compatible with their \(H_1\)

    Allow 0.7155. If their \(H_1\) is two-tailed, allow ±0.7646 for this mark. Independent of the hypotheses mark. 0.7155 is an exact table value.

  4. 1 mark

    A1 \(-0.762 < -0.7155\), so reject \(H_0\): there is evidence at the 1% level of a negative correlation between Daily Mean Total Cloud and Daily Total Sunshine at Leuchars (days with more cloud tend to have less sunshine)

    Depends on the M1. Follow through their r (between −1 and 1) with compatible signs. Must mention negative correlation (or relationship) and both variables (cloud and sunshine), or Kamal's idea. Contradictory statements score A0.

  5. 1 mark

    B1 Daily Total Sunshine at Leuchars is not recorded (it is n/a) for the days in May 1987 before 18/05/1987, so those days have no sunshine value that he could use

    Needs the idea that the sunshine values are missing (n/a, not available) for those dates. B0 for "cloud was not recorded" (cloud is recorded on those days), or for reasons about the weather in early May.

Question 4

7 marks

A running club records, for a random sample of 26 members, the number of hours, \(h\), that each member spent using a training app over 8 weeks and the improvement, \(m\) seconds, in their 5 km time over the same 8 weeks. The product moment correlation coefficient between \(h\) and \(m\) is 0.3531

Coach Amy believes that members who spend more time using the app tend to improve more. Coach Ben believes that time using the app and improvement are correlated, in one direction or the other.

Test each coach's belief at the 5% level of significance, stating your hypotheses clearly and the critical value used for each test.

Explain why the two tests lead to different conclusions even though they use the same data and the same significance level.

[One-tailed critical values of the PMCC: \(n = 26\); significance level 10%: 0.2598, 5%: 0.3297, 2.5%: 0.3882, 1%: 0.4534, 0.5%: 0.4958]

Model answer

Amy: \(H_0: \rho = 0\), \(H_1: \rho > 0\)
Critical value (\(n = 26\), one-tailed 5%): 0.3297
\(0.3531 > 0.3297\): significant. There is evidence at the 5% level of a positive correlation between hours using the app and improvement in 5 km time, which supports Amy's belief.
Ben: \(H_0: \rho = 0\), \(H_1: \rho ≠ 0\)
Critical values (two-tailed 5%, 0.025 in each tail): \(\pm 0.3882\)
\(0.3531 < 0.3882\): not significant. There is insufficient evidence at the 5% level of a correlation between hours using the app and improvement, so Ben's belief is not supported.
In Ben's two-tailed test the 5% is shared between the two tails, so only 2.5% is in the upper tail and the critical value is larger. The value 0.3531 lies between 0.3297 and 0.3882, so it is significant in Amy's test but not in Ben's.

Explanation

The wording of each belief decides the tails: "tend to improve more" is a positive correlation (one-tailed), while "correlated, in one direction or the other" has no direction (two-tailed). A two-tailed test at 5% puts only 2.5% in each tail, so it needs a larger r, and 0.3531 falls between the two critical values. The tails must be chosen from the claim before the data are seen, never from the value of r.

Mark scheme
  1. 1 mark

    B1 Amy: \(H_0: \rho = 0\), \(H_1: \rho > 0\). Conclusions with no working (no hypotheses and no critical values) score 0 marks.

    An answer of "Amy's belief is supported but Ben's is not" with no working scores 0 marks: the hypotheses and critical values must be seen. Hypotheses must be in terms of \(\rho\), attached to \(H_0\) and \(H_1\).

  2. 1 mark

    M1 Amy's critical value 0.3297 (the 5% column for \(n = 26\))

    Compatible with their \(H_1\) for Amy.

  3. 1 mark

    A1 0.3531 > 0.3297, so reject \(H_0\): there is evidence at the 5% level of a positive correlation between hours using the app and improvement in 5 km time, which supports Amy's belief

    Depends on the M1. Must mention positive correlation and both variables, or Amy's belief. Contradictory statements score A0.

  4. 1 mark

    B1 Ben: \(H_0: \rho = 0\), \(H_1: \rho ≠ 0\)

    Ben's belief has no direction, so the test is two-tailed. \(H_1: \rho > 0\) for Ben scores B0.

  5. 1 mark

    M1 Ben's critical value \(\pm 0.3882\) (the 2.5% column for \(n = 26\))

    Compatible with their \(H_1\) for Ben. Using 0.3297 again is M0 unless their \(H_1\) for Ben is one-tailed.

  6. 1 mark

    A1 0.3531 < 0.3882, so do not reject \(H_0\): there is insufficient evidence at the 5% level of a correlation between hours using the app and improvement, so Ben's belief is not supported

    Depends on the M1 just before. Must mention correlation and both variables, or Ben's belief. Condone a definite statement in context for this non-significant result, e.g. "there is no correlation between hours using the app and improvement" (Pearson's schemes accepted definite wording such as "the proportion is still 0.015" for a non-significant test), although the evidence wording is preferred. Contradictory statements score A0.

  7. 1 mark

    B1 In the two-tailed test the 5% is split between the two tails (2.5% in each), so its critical value is larger (0.3882 rather than 0.3297); r = 0.3531 lies between the two critical values

    Needs the idea that the two-tailed test has 2.5% in the upper tail (or uses a larger critical value), so the same r can be significant in one test and not the other. B0 for "Ben used a different level" or "Amy's test is easier" with no reason.

Ready to try the rest? Every answer you write is marked against the mark scheme, so you can see exactly where the marks are.

Study Helper Hints first, answers after you try

Stuck on this one? Ask for a hint and I’ll point you in the right direction, without giving the answer away. Once you’ve checked your answer, I’ll show you how the marks are awarded.