
Level:
Correct: 0
Incorrect: 0
Marks: 0/0
Exam Practice
Course:
Topics:
OCR GCSE Biology (Paper 2) Smart practice A mixed round aimed at your weak spots
Avg
score:
–
Topics
done:
0/28

Field investigations: distribution and abundance

Practise 16 exam-style questions on Field investigations: distribution and abundance for OCR GCSE Biology (Paper 2). Write your answer as you would in the exam and get it marked in seconds against the mark scheme, point by point, with the Study Helper on hand if you get stuck.

  • 16 questions
  • 1–6 marks each
  • Instant marking
  • No sign-up needed
16 questions, marked as you go

Sample questions with model answers

Here are 4 of the questions in this topic, each with a model answer, an explanation of why it earns the marks and the mark scheme an examiner would use.

Question 1

1 mark

An ecologist surveyed the plants in 200 churchyards. In each churchyard she used quadrats to find the mean number of plant species per quadrat.

She described a churchyard as 'species-rich' if its mean number of species per quadrat was above the 75th percentile of the results for all 200 churchyards.

About how many of the 200 churchyards were species-rich?

Choose your answer.

  • A 25
  • B 50
  • C 75
  • D 150

Model answer

B (100% − 75% = 25% of the churchyards, and 25% of 200 = 50)

Explanation

A percentile tells you what percentage of the results are at or below a value. About 75% of the churchyards are at or below the 75th percentile, so about 25% are above it: 25 ÷ 100 × 200 = 50 churchyards. The 50th percentile is the median.

Mark scheme
  1. 1 mark

    B / 50

    The only correct answer is B: about 75% of the results are at or below the 75th percentile, so about 25% of the churchyards are above it, and 25% of 200 churchyards is 50 churchyards. A is not correct because 25 is the percentage of the churchyards above the 75th percentile, not the number of churchyards; C is not correct because 75 is the percentile, not a number of churchyards; D is not correct because about 150 churchyards (75%) were at or below the 75th percentile, so they were not species-rich. ALLOW the letter or the option. If more than one option is given, do not award the mark.

Question 2

2 marks

A student caught two ladybirds in a sweep net in a meadow.

Ladybird P is yellow, with black spots that are square-shaped and often joined together.

Ladybird Q is dark red-brown (maroon), with cream spots.

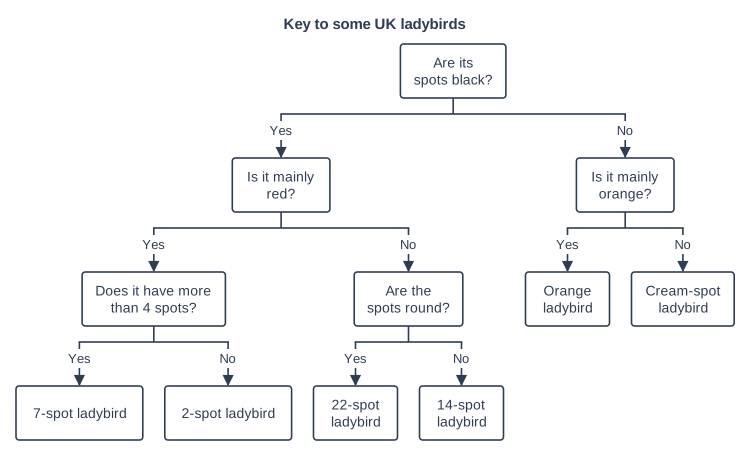
Use the key to name ladybird P and ladybird Q.

Key to some UK ladybirds. Flow chart of 11 boxes joined by arrows, read from top to bottom. The first box is "Are its spots black?". From "Are its spots black?", 2 arrows branch out side by side: the left arrow, labelled "Yes", leads to "Is it mainly red?"; the right arrow, labelled "No", leads to "Is it mainly orange?". From "Is it mainly red?", 2 arrows branch out side by side: the left arrow, labelled "Yes", leads to "Does it have more than 4 spots?"; the right arrow, labelled "No", leads to "Are the spots round?". From "Is it mainly orange?", 2 arrows branch out side by side: the left arrow, labelled "Yes", leads to "Orange ladybird"; the right arrow, labelled "No", leads to "Cream-spot ladybird". From "Does it have more than 4 spots?", 2 arrows branch out side by side: the left arrow, labelled "Yes", leads to "7-spot ladybird"; the right arrow, labelled "No", leads to "2-spot ladybird". From "Are the spots round?", 2 arrows branch out side by side: the left arrow, labelled "Yes", leads to "22-spot ladybird"; the right arrow, labelled "No", leads to "14-spot ladybird".

Model answer

P is the 14-spot ladybird.
Q is the cream-spot ladybird.

Explanation

Follow the key one question at a time. P has black spots, is not mainly red and its spots are not round, so it is the 14-spot ladybird. Q's spots are not black and it is not mainly orange, so it is the cream-spot ladybird. Keys let you identify organisms you find in field work without knowing their names first.

Mark scheme
  1. 1 mark

    P: 14-spot ladybird

    ALLOW fourteen-spot ladybird. DO NOT ALLOW 22-spot ladybird (its spots are round).

  2. 1 mark

    Q: cream-spot ladybird

    ALLOW cream spot ladybird. DO NOT ALLOW orange ladybird (Q is not mainly orange).

Question 3

2 marks

Great crested newts are a protected species that breed in ponds. Since 2014, ecologists in England have been able to find out whether great crested newts live in a pond by collecting samples of the pond water and testing them for newt DNA. This DNA (called eDNA) comes from skin cells, mucus and droppings that the newts leave in the water.

Give one advantage and one disadvantage of using eDNA, instead of catching newts with nets, to survey ponds for great crested newts.

Model answer

Advantage: the newts do not need to be caught with nets, so this protected species is not disturbed or harmed.
Disadvantage: eDNA only shows that newts are present in the pond, not how many there are.

Explanation

Field investigations study distribution (where organisms are) and abundance (how many). An eDNA test is good for distribution, because it finds even a few newts without catching them, but it cannot measure abundance. Netting or capture-recapture is still needed to estimate the number of newts.

Mark scheme
  1. 1 mark

    advantage: the newts do not have to be caught or handled, so they are not disturbed or harmed

    Max 1 if the answer gives only one side (only advantages or only disadvantages). 1 mark for an advantage (points 1 to 3) and 1 mark for a disadvantage (points 4 to 6). If more than one answer is given, a wrong one cancels a right one (for the advantage and for the disadvantage separately). ALLOW it is better for a protected species.

  2. 1 mark

    advantage: it can show that newts are present even when there are very few of them or they are hard to find

    ALLOW it is more likely to detect newts than netting.

  3. 1 mark

    advantage: it is quicker / needs fewer visits to the pond

    ALLOW it takes less time than netting.

  4. 1 mark

    disadvantage: it shows whether newts are present, but not how many there are (their abundance)

    ALLOW it cannot estimate the population size / cannot show the size, age or health of the newts.

  5. 1 mark

    disadvantage: the DNA may come from newts that are no longer in the pond, or be carried in from elsewhere

    ALLOW the result may be wrong if the DNA has broken down or the sample is contaminated.

  6. 1 mark

    disadvantage: the samples must be tested in a laboratory, which costs money or takes time

    ALLOW expensive equipment is needed.

Question 4

4 marks

Some woods in the UK are managed by coppicing: the hazel trees in one patch are cut down to near the ground every few years, and then grow again. A student compared two patches of a coppiced wood:
• patch A was coppiced 2 years ago
• patch B was coppiced 12 years ago.

She placed five quadrats at random in each patch and estimated the percentage cover of wild flowers on the ground. The table shows her results.

Calculate the mean percentage cover of wild flowers in patch A (value X).

The student concluded: 'The cover of wild flowers decreases as the time since coppicing increases.'

Give two reasons why this conclusion may not be valid.

Percentage cover of wild flowers (%). Table with columns "Patch", "Quadrat 1", "Quadrat 2", "Quadrat 3", "Quadrat 4", "Quadrat 5", "Mean". Patch: A (coppiced 2 years ago); Quadrat 1: 35; Quadrat 2: 50; Quadrat 3: 40; Quadrat 4: 45; Quadrat 5: 30; Mean: X | Patch: B (coppiced 12 years ago); Quadrat 1: 10; Quadrat 2: 5; Quadrat 3: 15; Quadrat 4: 5; Quadrat 5: 15; Mean: 10.

Model answer

Mean for patch A = (35 + 50 + 40 + 45 + 30) ÷ 5 = 200 ÷ 5 = 40%

The conclusion may not be valid because only two patches were compared, so there is only one patch for each time since coppicing. Also, other factors such as the soil or grazing by deer may be different in the two patches.

Explanation

Add the five values and divide by 5 to get 40%. A valid conclusion needs a fair comparison: with only one patch for each time, any difference could be caused by something else that differs between the patches, such as the soil or grazing. A bigger sample of quadrats and more patches coppiced at different times would give a more valid conclusion.

Mark scheme
  1. 1 mark

    method: (35 + 50 + 40 + 45 + 30) ÷ 5 / 200 ÷ 5; or a correct final answer of 40% with no working

    An answer of 40% with no working scores marking points 1 and 2 only. DO NOT ALLOW 200 (the total) for either mark. For the two reasons: if more than two answers are given, a wrong one cancels a right one.

  2. 1 mark

    evaluation: 40 (%)

    IGNORE units.

  3. 1 mark

    only two patches were compared

    1 mark for each of points 3 to 6, max 2. If more than two reasons are given, a wrong one cancels a right one. ALLOW there is only one patch for each time since coppicing / no other times were tested.

  4. 1 mark

    only five quadrats were used in each patch (a small sample)

    ALLOW the sample may not be representative of the patch.

  5. 1 mark

    other factors may differ between the patches (such as soil, water, slope or grazing by deer)

    ALLOW a named factor that could differ between the patches. IGNORE the weather on its own.

  6. 1 mark

    percentage cover is an estimate, so it is not exact / different people may estimate it differently

    ALLOW estimating cover is subjective.

Ready to try the rest? Every answer you write is marked against the mark scheme, so you can see exactly where the marks are.

Study Helper Hints first, answers after you try

Stuck on this one? Ask for a hint and I’ll point you in the right direction, without giving the answer away. Once you’ve checked your answer, I’ll show you how the marks are awarded.