Level:
Correct: 0
Incorrect: 0
Marks: 0/0
Exam Practice
Course:
Topics:
OCR GCSE Physics (Paper 3) Smart practice A mixed round aimed at your weak spots
Unit 1
Matter
Unit 2
Forces
Unit 3
Electricity
Unit 4
Magnetism and magnetic fields
Unit 9
Practical skills
Avg
score:
–
Topics
done:
0/36

Distance-time and velocity-time graphs

Practise 17 exam-style questions on Distance-time and velocity-time graphs for OCR GCSE Physics (Paper 3). Write your answer as you would in the exam and get it marked in seconds against the mark scheme, point by point, with the Study Helper on hand if you get stuck.

  • 17 questions
  • 1–6 marks each
  • Instant marking
  • No sign-up needed
17 questions, marked as you go

Sample questions with model answers

Here are 4 of the questions in this topic, each with a model answer, an explanation of why it earns the marks and the mark scheme an examiner would use.

Question 1

1 mark

A walker records her progress along a long-distance footpath. She plots a distance-time graph with distance in kilometres and time in hours. One section of her graph is a straight line with a gradient of 4.5.

What is the walker's speed during this section, in m/s?

Choose your answer.

  • A 0.075 m/s
  • B 1.25 m/s
  • C 4.5 m/s
  • D 16.2 m/s

Model answer

B
Gradient = speed = 4.5 km/h
4.5 km/h = 4500 m ÷ 3600 s = 1.25 m/s

Explanation

The gradient of a distance-time graph is the speed, measured in the units of its axes: here kilometres per hour. To change km/h to m/s, multiply by 1000 and divide by 3600, which is the same as dividing by 3.6. Common errors are converting only the time or only the distance, and multiplying by 3.6 instead of dividing.

Mark scheme
  1. 1 mark

    B / 1.25 m/s

    The only correct answer is B: the gradient of a distance-time graph is the speed, in the units of the axes, so the speed is 4.5 km/h = 4500 m ÷ 3600 s = 1.25 m/s. A is not correct because it comes from dividing 4.5 by 60 only; C is not correct because 4.5 is the speed in km/h, not in m/s; D is not correct because it comes from multiplying 4.5 by 3.6 instead of dividing by 3.6. ALLOW the letter or the option. If more than one option is given, do not award the mark.
Question 2

2 marks

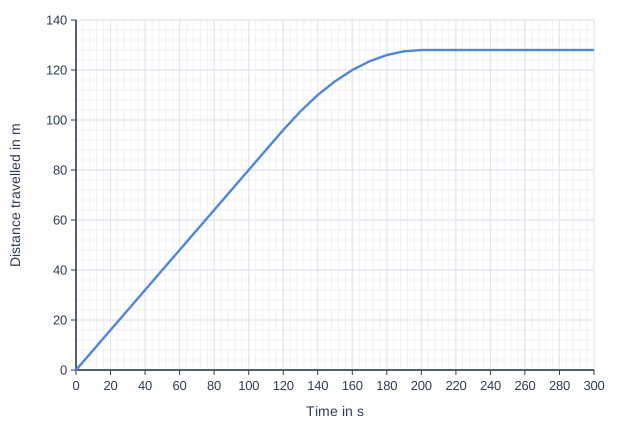
A narrowboat travels along a canal towards a lock. The graph shows the distance travelled by the narrowboat against time.

Describe the motion of the narrowboat between 120 s and 200 s, and explain how the graph shows this.

Line graph of distance travelled in m (y-axis, 0 to 140) against time in s (x-axis, 0 to 300). The line joins the points (0, 0), (120, 96), (130, 103.5), (140, 110), (150, 115.5), (160, 120), (170, 123.5), (180, 126), (190, 127.5), (200, 128), (300, 128).

Model answer

The narrowboat slows down and stops at 200 s. The graph shows this because the line curves and gets less steep: the gradient, which is the speed, gets smaller until the line is horizontal.

Explanation

The gradient of a distance-time graph is the speed. A straight line means a constant speed, a line that gets less steep means the object is slowing down, and a horizontal line means it is not moving. A common error is to describe the curve as the boat moving downhill or backwards.

Mark scheme
  1. 1 mark

    slowing down / decelerating (until it stops at 200 s)

    ALLOW slows down and then stops. DO NOT ALLOW 'moving backwards' or 'going downhill'.

  2. 1 mark

    the gradient (slope) of the line decreases / the line gets less steep (until it is horizontal at 200 s)

    ALLOW the curve levels off or flattens out. ALLOW the gradient is the speed and it gets smaller.

Question 3

3 marks

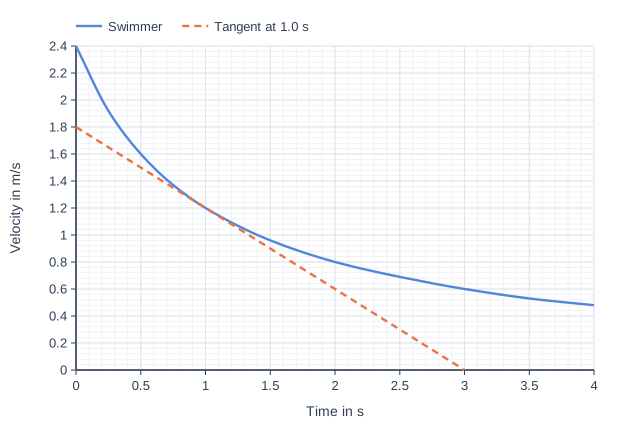
A swimmer pushes off from the wall of a pool and glides under the water without kicking. The water slows her down. The graph shows her velocity for the 4.0 s after she leaves the wall. A tangent to the curve has been drawn at 1.0 s.

Use the tangent to determine the deceleration of the swimmer at 1.0 s.

Line graph of velocity in m/s (y-axis, 0 to 2.4) against time in s (x-axis, 0 to 4). "Swimmer" is a smooth curve through (0, 2.4), (0.25, 1.92), (0.5, 1.6), (0.75, 1.37), (1, 1.2), (1.5, 0.96), (2, 0.8), (2.5, 0.69), (3, 0.6), (3.5, 0.53), (4, 0.48). "Tangent at 1.0 s" (dashed) joins the points (0, 1.8), (3, 0).

Model answer

Two points on the tangent: (0, 1.8 m/s) and (3.0 s, 0)
Change in velocity = 0 − 1.8 = −1.8 m/s
Time = 3.0 − 0 = 3.0 s
Gradient of the tangent = −1.8 ÷ 3.0 = −0.60 m/s²
Deceleration at 1.0 s = 0.60 m/s²

Explanation

The deceleration at one instant is the size of the gradient of the tangent to the velocity–time curve at that time, so read two points far apart on the tangent, not on the curve. The gradient is negative because the swimmer is slowing down. The curve gets less steep as she slows, so her deceleration decreases; points on the curve give an average over a time interval, not the value at 1.0 s.

Mark scheme
  1. 1 mark

    reads two points on the tangent, for example (0, 1.8) and (3.0, 0) / change in velocity = 0 − 1.8 = −1.8 m/s over 3.0 s; or a correct final answer of any value from 0.55 to 0.65 m/s² with no working

    An answer from 0.55 to 0.65 m/s² with no working scores 3 marks. ALLOW any two points read from the tangent. A value worked out from points on the curve instead of the tangent, for example (2.4 − 1.2) ÷ 1.0 = 1.2 m/s² (the average deceleration over the first 1.0 s) or 1.2 ÷ 1.0 = 1.2 m/s², scores 0.

  2. 1 mark

    deceleration = size of the gradient of the tangent = change in velocity ÷ time = 1.8 ÷ 3.0; or a correct final answer of any value from 0.55 to 0.65 m/s² with no working

    ALLOW ECF from wrong readings of the tangent. ALLOW −1.8 ÷ 3.0.

  3. 1 mark

    evaluation: 0.60 (m/s²)

    ALLOW any value from 0.55 to 0.65. ALLOW an acceleration of −0.60 m/s².

Question 4

4 marks

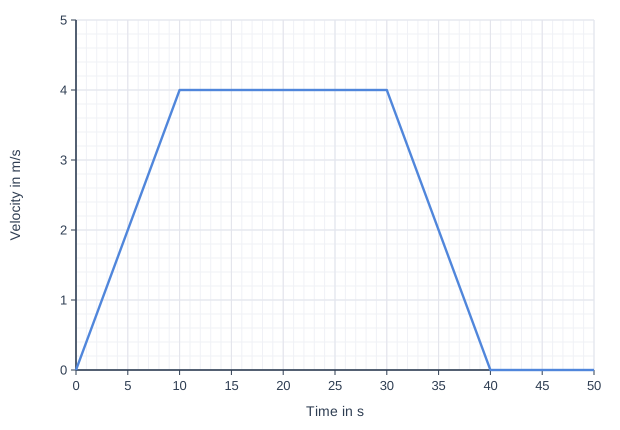
A golf buggy travels along a straight path between two holes on a golf course. The graph shows the velocity of the buggy against time.

A distance-time graph is drawn for the same 50 s.

Describe how the gradient of the distance-time graph changes during the 50 s. Explain your answer.

Line graph of velocity in m/s (y-axis, 0 to 5) against time in s (x-axis, 0 to 50). The line joins the points (0, 0), (10, 4), (30, 4), (40, 0), (50, 0).

Model answer

The gradient of a distance-time graph is the speed, so it follows the value of the velocity on this graph.
From 0 to 10 s the velocity increases from 0 to 4 m/s, so the distance-time graph curves upwards, getting steeper.
From 10 s to 30 s the velocity is a constant 4 m/s, so the distance-time graph is a straight line with a gradient of 4 m/s.
From 30 s to 40 s the velocity decreases to zero, so the line gets less steep.
From 40 s to 50 s the buggy is stationary, so the line is horizontal, with a gradient of zero.

Explanation

To change a velocity-time graph into a distance-time graph, read the velocity at each time: that value is the gradient of the distance-time graph at that time. A rising velocity gives a curve that gets steeper, a constant velocity gives a straight line, and zero velocity gives a horizontal line. A common error is to copy the shape of the velocity-time graph.

Mark scheme
  1. 1 mark

    0 to 10 s: the gradient increases / the line curves upwards and gets steeper (from 0 to 4 m/s)

    1 mark for each point, max 4. Max 3 if the gradient of the distance-time graph is not linked to the velocity (marking point 5). ALLOW the times to within ±1 s.

  2. 1 mark

    10 s to 30 s: the gradient is constant / the line is straight (with a gradient of 4 m/s)

  3. 1 mark

    30 s to 40 s: the gradient decreases (to zero) / the line gets less steep

  4. 1 mark

    40 s to 50 s: the gradient is zero / the line is horizontal (the buggy is stationary)

  5. 1 mark

    the gradient of a distance-time graph is the speed, which is the value shown on the velocity-time graph at each time

    ALLOW gradient of the distance-time graph = velocity.

Ready to try the rest? Every answer you write is marked against the mark scheme, so you can see exactly where the marks are.

Study Helper Hints first, answers after you try

Stuck on this one? Ask for a hint and I’ll point you in the right direction, without giving the answer away. Once you’ve checked your answer, I’ll show you how the marks are awarded.