
Level:
Correct: 0
Incorrect: 0
Marks: 0/0
Exam Practice
Course:
Topics:
Edexcel GCSE Business (Paper 1) Smart practice A mixed round aimed at your weak spots
Unit 1
Enterprise and entrepreneurship
The dynamic nature of business
Risk and reward
Risk and reward
Unit 2
Spotting a business opportunity
Unit 3
Putting a business idea into practice
Unit 4
Making the business effective
The options for start-up and small businesses
Limited liability and types of business ownership
Franchising
Business location
Business location
The marketing mix
The marketing mix
Business plans
Business plans
Unit 5
Understanding external influences on business
Business stakeholders
Technology and business
Legislation and business
The economy and business
Avg
score:
–
Topics
done:
0/24

The use of data in market research

Practise 18 exam-style questions on The use of data in market research for Edexcel GCSE Business (Paper 1). Write your answer as you would in the exam and get it marked in seconds against the mark scheme, point by point, with the Study Helper on hand if you get stuck.

  • 18 questions
  • 1–12 marks each
  • Instant marking
  • No sign-up needed
18 questions, marked as you go

Sample questions with model answers

Here are 4 of the questions in this topic, each with a model answer, an explanation of why it earns the marks and the mark scheme an examiner would use.

Question 1

1 mark

Define the term 'quantitative data'.

Model answer

Quantitative data is data in the form of numbers or statistics that can be counted or measured, such as the percentage of customers who would buy a product.

Explanation

Quantitative data is numerical, so it can be counted, measured and shown in tables and charts. Students often confuse it with qualitative data, which is about opinions and reasons, or with primary research, which is about who collects the data.

Mark scheme
  1. 1 mark

    Data in the form of numbers or statistics / data that can be counted or measured

    Accept any wording with the same meaning, e.g. 'numerical data', 'facts and figures such as totals or percentages', 'information that can be measured and put into charts'. An example alone (e.g. '60% of customers') is not enough without the idea of numbers or measurement. Do not accept: data about opinions, feelings or reasons (qualitative data); 'data collected from a large number of people'; 'data the business collects itself' (primary research); 'data about quantity' with no reference to numbers or measurement.
Question 2

2 marks

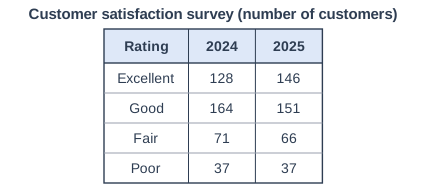
The table shows the results of a customer satisfaction survey carried out by a small business in 2024 and 2025.

Using the information in the table, calculate, to 2 decimal places, the percentage change in 'Excellent' ratings from 2024 to 2025.

Customer satisfaction survey (number of customers). Table with columns "Rating", "2024", "2025". Rating: Excellent; 2024: 128; 2025: 146 | Rating: Good; 2024: 164; 2025: 151 | Rating: Fair; 2024: 71; 2025: 66 | Rating: Poor; 2024: 37; 2025: 37.

Model answer

Change = 146 - 128 = 18
Percentage change = 18 ÷ 128 × 100 = 14.0625
= 14.06%

Explanation

Percentage change is the change divided by the original (2024) figure, multiplied by 100. The usual error is to divide by the new figure, which gives 12.33%; the other rows of the table are not needed.

Mark scheme
  1. 1 mark

    Fully correct working, e.g. (146 - 128) ÷ 128 × 100; or a correct final answer of 14.06% with no working

    An answer of 14.06% with no working scores 2 marks. If the final answer is wrong, award this mark only for fully correct working (the change of 18 divided by the 2024 figure of 128, × 100); a formula alone or partly correct working scores 0. If several different final answers are given, award 0. Max 1 if the answer is not given to 2 decimal places: a correct answer such as 14.1% or 14% scores this mark only, with or without working.

  2. 1 mark

    14.06%

    Accept 14.06 or +14.06% or 'an increase of 14.06%'. Do not accept 14.1 or 14 for this mark (see the first point). Common wrong answers that score 0 here: 12.33% or 12.32% (the change divided by the 2025 figure, 18 ÷ 146); 18 (the change in number, not a percentage); 4.5 (the change in the share of all 400 customers, in percentage points); -14.06% (a decrease).

Question 3

3 marks

Explain one reason why a small business might collect qualitative market research data.

Model answer

Qualitative data shows why customers like or dislike a product, not just how many do. This means the owner can see exactly what needs to change, such as the size or the flavour. As a result, the business can improve the product so that it meets customer needs better before more money is spent making it.

Explanation

Qualitative data is about opinions and reasons, so the best reasons for collecting it are understanding why customers behave as they do and getting detailed ideas for improvement. A reason that really describes numerical data, such as counting how many would buy, does not score.

Mark scheme
  1. 1 mark

    Award 1 mark for identification of a reason why a small business might collect qualitative market research data.

    Answers that list more than one reason with no explanation will be awarded a maximum of 1 mark. Accept any other appropriate response. Valid reasons include: to find out why customers feel or behave as they do; to get detailed opinions on a product, service or idea; to find out what customers like or dislike so the product can be improved; to gather ideas for new products; to understand customer needs in depth. Do not accept reasons that describe quantitative data, such as 'to find out how many customers would buy' or 'it is easy to put into charts'.

  2. 2 marks

    Award up to 2 further marks for explaining this reason (1 mark for each linked strand of development).

    Examples: Qualitative data shows why customers like or dislike a product, not just how many do (1). This means the owner can see exactly what needs to change, such as the size or flavour (1). As a result, the business can improve the product so that it meets customer needs better before more money is spent making it (1). / Customers' comments can give the owner ideas that they had not thought of (1). Therefore the business may be able to develop a new product or service that its customers want (1). This could help it offer something that competitors do not, so customers choose it over its rivals (1). A restatement of the reason, an example or a definition of qualitative data is not a strand. Vague endings such as 'the business will be more successful' are not credited.

Question 4

6 marks

Zara makes silver earrings and necklaces at home in Brighton and sells them through her online shop, Silvermoth Jewellery. She has 9,400 followers on Instagram, most of them women aged 18 to 30, which is her target market.

Before she makes a new collection, Zara posts short videos of three or four possible designs on TikTok and Instagram and counts the likes and shares. She also runs a poll in her Instagram stories asking followers to vote for their favourite design. Last month 1,300 followers voted, and many left comments asking for the designs in gold as well as silver. Zara buys her silver in small amounts, so she needs to know which designs will sell before she orders it.

Analyse the benefit to Silvermoth Jewellery of collecting research data through Instagram and TikTok.

Model answer

Zara's poll was answered by 1,300 followers, and most of her 9,400 followers are women aged 18 to 30, who are her target market. This means the votes show her which designs her real customers like best before she makes the collection. Therefore she can order silver only for the earrings and necklaces that are most likely to sell. As a result, she wastes less money on silver for unpopular designs, which keeps her costs down and means she is less likely to be left with unsold stock.

The comments under her posts are qualitative data, and many followers asked for the designs in gold as well as silver. Because this research is free and the results come in within days, Zara can act on it quickly. This means she could add gold versions to the new collection, which meets a need she had not planned for. As a result, she could gain extra orders from followers who would not have bought the silver designs, increasing Silvermoth's revenue.

Explanation

A top answer develops one or two benefits of social media as a research tool through about five linked strands, using the case throughout: the 1,300 votes, the 18 to 30 target market, the requests for gold and the need to order silver in advance. Benefits of social media advertising answer a different question and are not credited.

Mark scheme
  1. 6 marks

    Levels of response (6 marks).
    Level 3 (5-6 marks): Detailed application of knowledge and understanding of business concepts and issues to the business context throughout (AO2). Deconstructs business information and/or issues, finding detailed interconnected points with logical chains of reasoning (AO3a).
    Level 2 (3-4 marks): Sound application of knowledge and understanding of business concepts and issues to the business context although there may be some inconsistencies (AO2). Deconstructs business information and/or issues, finding interconnected points with chains of reasoning, although there may be some logical inconsistencies (AO3a).
    Level 1 (1-2 marks): Limited application of knowledge and understanding of business concepts and issues to the business context (AO2). Attempts to deconstruct business information and/or issues, finding limited connections between points (AO3a).
    0 marks: No rewardable material.

    Indicative content (not a checklist; credit other valid points):
    - The poll gives quantitative data from 1,300 voters, and her 9,400 followers are mostly women aged 18 to 30, Zara's target market; the likes and shares on TikTok and Instagram show which designs interest them (AO2).
    - The comments asking for gold as well as silver are qualitative data that show a customer need Zara had not planned for (AO2).
    - Therefore Zara can make only the most popular designs, so she orders silver only for earrings and necklaces that are likely to sell. As a result she wastes less money on stock, keeps her costs down and is less likely to be left with unsold jewellery (AO3a).
    - Because the research is free and gives results within days, Zara can test new designs before every collection. This means she can add a gold version that customers have asked for, so she meets their needs and could gain extra orders from followers who would not buy silver (AO3a).
    Marking notes: only the best two points are credited; Level 3 for AO3a needs about five linked strands from one or two points. Context only counts inside a valid point, and copying the case or using the business name or words from the question ('research data', 'Instagram', 'TikTok') is not application; 'jewellery' is part of the business name, so on its own it does not count as context. This question is about social media as a research tool: benefits of social media as promotion (e.g. advertising the collection to followers) are not credited unless linked to collecting data. A generic answer with no application to Silvermoth Jewellery cannot score more than 3 marks. Evaluation (e.g. followers may not be typical) is not required and is not credited.

Ready to try the rest? Every answer you write is marked against the mark scheme, so you can see exactly where the marks are.

Study Helper Hints first, answers after you try

Stuck on this one? Ask for a hint and I’ll point you in the right direction, without giving the answer away. Once you’ve checked your answer, I’ll show you how the marks are awarded.