Level:
Correct: 0
Incorrect: 0
Marks: 0/0
Exam Practice
Course:
Topics:
Avg
score:
–
Topics
done:
0/17

Levels of organisation

Practise 24 exam-style questions on Levels of organisation for AQA GCSE Combined Science (Foundation Biology Paper 2). Write your answer as you would in the exam and get it marked in seconds against the mark scheme, point by point, with the Study Helper on hand if you get stuck.

  • 24 questions
  • 1–6 marks each
  • Instant marking
  • No sign-up needed
20 questions, marked as you go

Sample questions with model answers

Here are 4 of the questions in this topic, each with a model answer, an explanation of why it earns the marks and the mark scheme an examiner would use.

Question 1

1 mark

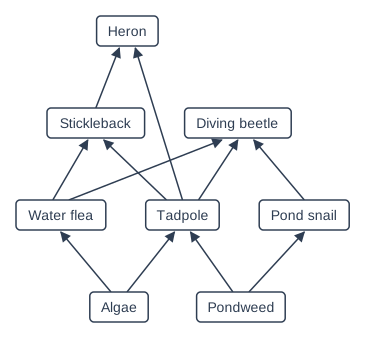
The diagram shows a food web in a pond.

Which organism in the food web is a tertiary consumer?

Choose your answer.

  • Tadpole
  • Stickleback
  • Pondweed
  • Heron
Food web of 8 organisms in 4 rows, joined by arrows. Bottom row (left to right): Algae and Pondweed. Second row from the bottom (left to right): Water flea, Tadpole and Pond snail. Third row from the bottom (left to right): Stickleback and Diving beetle. Top row: Heron. Arrows point from Algae to Water flea and Tadpole; from Pondweed to Tadpole and Pond snail; from Water flea to Stickleback and Diving beetle; from Tadpole to Stickleback, Diving beetle and Heron; from Pond snail to Diving beetle; from Stickleback to Heron.

Model answer

Heron

Explanation

Following the arrows: pondweed or algae (producer) → tadpole or water flea (primary consumer) → stickleback (secondary consumer) → heron (tertiary consumer). The heron is a tertiary consumer when it eats sticklebacks. Students who read the arrows the wrong way round often choose the tadpole.

Mark scheme
  1. 1 mark

    Heron

    If more than one option is given, 0 marks. Pondweed is a producer, the tadpole is a primary consumer and the stickleback is a secondary consumer.

Question 2

2 marks

In the open ocean, almost all the producers are microscopic algae that float near the surface of the water.

Explain why the animals in the open ocean depend on these algae.

Model answer

The algae are the producers: they make glucose and other molecules (biomass) by photosynthesis. Animals cannot make their own food, so they get their biomass by eating the algae, or by eating animals that have eaten the algae.

Explanation

Photosynthetic organisms are the producers of biomass for life on Earth. Almost every food chain in the open ocean begins with algae, so the consumers depend on them directly or indirectly. A common error is to describe energy as being made: in photosynthesis, energy from light is transferred to glucose.

Mark scheme
  1. 1 mark

    algae make glucose / biomass / food by photosynthesis

    allow algae are producers of biomass. allow algae are at the start of every food chain. ignore algae make energy.

  2. 1 mark

    animals cannot make their own food, so they get biomass by eating the algae or by eating animals that have eaten algae

    allow consumers eat the algae (directly or indirectly). allow (almost) every food chain in the ocean starts with algae. allow algae release oxygen that animals use for respiration.

Question 3

2 marks

Soft rush is a plant that grows in wet ground. A student placed one transect line from the edge of a pond out across a field. She placed a quadrat every 2 m along the line, counted the soft rush plants in each quadrat and measured the soil moisture with a moisture meter.

Both the number of soft rush plants and the soil moisture decreased with distance from the pond.

The student concluded: 'Soil moisture is the only factor that affects where soft rush grows in this field.'

Give two reasons why this conclusion may not be valid.

Model answer

Other factors may also change with distance from the pond, such as soil pH or the amount of grazing and competition from grasses, but the student only measured soil moisture. She also used only one transect, and a correlation between soil moisture and soft rush does not prove that moisture is the only cause.

Explanation

In fieldwork other variables cannot be controlled, so several abiotic and biotic factors may change together along a transect. A correlation suggests a link but does not prove cause, and one transect gives too few results to be confident. Answers such as 'she might have made a mistake' are too vague to score.

Mark scheme
  1. 1 mark

    other abiotic factors may also change with distance from the pond, e.g. soil pH / mineral ions / light intensity / temperature

    Any two from the six points, max 2. Two answers are asked for: each wrong or contradictory extra answer cancels a correct one (list rule). allow a named factor, e.g. the soil near the pond may have a different pH.

  2. 1 mark

    biotic factors may affect the soft rush, e.g. competition from other plants / grazing or trampling by animals

    allow grass may grow better further from the pond and compete with the rush (for light / water / mineral ions). allow animals (e.g. cattle) graze / trample the field away from the pond.

  3. 1 mark

    a correlation does not prove that one factor causes the other

    allow the link between soil moisture and soft rush may be a coincidence.

  4. 1 mark

    only soil moisture was measured / other factors were not measured or controlled

  5. 1 mark

    only one transect was used / the transect was not repeated

    allow too few results / no repeats to calculate a mean.

  6. 1 mark

    only one field / one pond was investigated

    max 2. ignore 'the moisture meter may be faulty' unqualified.

Question 4

4 marks

A student estimated the number of dandelion plants on a school field. The field measures 50 m by 30 m.

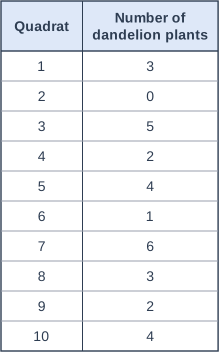
She placed 10 quadrats at random on the field. Each quadrat measured 0.5 m by 0.5 m. The table shows her results.

Estimate the number of dandelion plants on the field.

Use the equation:
estimated population = mean number per quadrat × (total area ÷ area of one quadrat)

Table with columns "Quadrat", "Number of dandelion plants". Quadrat: 1; Number of dandelion plants: 3 | Quadrat: 2; Number of dandelion plants: 0 | Quadrat: 3; Number of dandelion plants: 5 | Quadrat: 4; Number of dandelion plants: 2 | Quadrat: 5; Number of dandelion plants: 4 | Quadrat: 6; Number of dandelion plants: 1 | Quadrat: 7; Number of dandelion plants: 6 | Quadrat: 8; Number of dandelion plants: 3 | Quadrat: 9; Number of dandelion plants: 2 | Quadrat: 10; Number of dandelion plants: 4.

Model answer

mean = (3 + 0 + 5 + 2 + 4 + 1 + 6 + 3 + 2 + 4) ÷ 10 = 30 ÷ 10 = 3
total area = 50 × 30 = 1500 m²
area of one quadrat = 0.5 × 0.5 = 0.25 m²
estimated population = 3 × (1500 ÷ 0.25) = 3 × 6000 = 18 000 dandelion plants

Explanation

Find the mean number per quadrat, the area of the field and the area of one quadrat, then use the equation. A 0.5 m by 0.5 m quadrat has an area of 0.25 m², not 0.5 m² - this is the most common error. The answer is an estimate because only a sample of the field was counted.

Mark scheme
  1. 1 mark

    mean number per quadrat = 30 ÷ 10 = 3

    A correct answer with no working scores full marks, but full marks are not awarded for a correct final answer from incorrect working.

  2. 1 mark

    total area = 50 × 30 = 1500 (m²)

  3. 1 mark

    area of one quadrat = 0.5 × 0.5 = 0.25 (m²) or 1500 ÷ 0.25 = 6000

  4. 1 mark

    18 000 (dandelion plants)

    allow ecf from their mean or areas. An answer of 4500 (using 1500 × 3, ignoring the quadrat area) scores 2 marks. An answer of 9000 (using a quadrat area of 0.5 m²) scores 3 marks.

Ready to try the rest? Every answer you write is marked against the mark scheme, so you can see exactly where the marks are.

Revision notes

Levels of organisation

The big idea

Almost all life on Earth depends on photosynthetic organisms: green plants and algae are the producers of biomass. Food chains show how that biomass passes from producers to consumers. Ecologists measure how many of each species there are, and where they live, using quadrats and transects.

Food chains

All food chains begin with a producer, which synthesises molecules. This is usually a green plant or an alga that makes glucose by photosynthesis, using energy transferred from light. It uses the glucose to make other molecules, such as starch, cellulose and proteins, which form its biomass.

  • Primary consumers eat producers.
  • Secondary consumers eat primary consumers.
  • Tertiary consumers eat secondary consumers.

The arrows in a food chain point from the organism that is eaten to the organism that eats it, showing the direction in which biomass is transferred.

A moorland food chain. Food chain drawn from left to right: Heather, then Heather beetles, then Meadow pipits, then Merlins, with an arrow pointing from each organism to the next one. Each arrow points from the organism that is eaten to the organism that eats it, showing the direction in which energy and biomass are transferred. Producer (trophic level 1): Heather. Primary consumer (trophic level 2, herbivore): Heather beetles. Secondary consumer (trophic level 3, carnivore): Meadow pipits. Tertiary consumer (trophic level 4, carnivore): Merlins. Nothing in the food chain eats Merlins.
Heather is the producer, heather beetles are primary consumers, meadow pipits are secondary consumers and merlins are tertiary consumers.

Predators and prey

Consumers that kill and eat other animals are predators, and the animals they eat are prey. In a stable community, the numbers of predators and prey rise and fall in cycles:

  1. When there are many prey, the predators have plenty of food, so more of them survive and breed.
  2. More predators eat more prey, so the prey population falls.
  3. With fewer prey, the predators have less food, so some starve and fewer young are raised; the predator population falls.
  4. With fewer predators, fewer prey are eaten, so the prey population rises again.

The predator peaks always come a little after the prey peaks, because it takes time for predators to breed when food is plentiful and to die off when it runs short.

A model of predator and prey cycles. Line graph of population size in arbitrary units (y-axis, 0 to 100) against time in years (x-axis, 0 to 16). "Prey" is a smooth curve through (0, 50), (1, 75), (2, 85), (3, 75), (4, 50), (5, 25), (6, 15), (7, 25), (8, 50), (9, 75), (10, 85), (11, 75), (12, 50), (13, 25), (14, 15), (15, 25), (16, 50). "Predator" (dashed) is a smooth curve through (0, 13), (1, 17), (2, 25), (3, 33), (4, 37), (5, 33), (6, 25), (7, 17), (8, 13), (9, 17), (10, 25), (11, 33), (12, 37), (13, 33), (14, 25), (15, 17), (16, 13).
In this model the prey peak every 8 years (years 2 and 10), and each predator peak comes 2 years after a prey peak.

Sampling: distribution and abundance

Abundance is how many individuals of a species there are. Distribution is where the species is found. You will need these maths terms:

  • mean: add all the values and divide by the number of values;
  • median: the middle value when the values are put in order;
  • mode: the value that appears most often.

Choose graph scales that are easy to read and make the data fill more than half of each axis. Use a line graph or scatter graph when the independent variable is continuous (such as distance), and a bar chart when it is a category (such as habitat).

Required practical: Quadrats and transects

Population size (random sampling): lay two tape measures at right angles along two edges of the area to make a grid. Use a random number generator to give pairs of coordinates and place a quadrat at each one. Count the species in each quadrat (decide a rule for plants on the edge first), or estimate percentage cover for plants such as grass and moss. Use at least 10 quadrats, find the mean per quadrat, convert it to a mean per m², then multiply by the total area.

Distribution (transect): lay a tape measure in a line across a change in habitat, for example from a tree into a field. Place a quadrat at regular intervals along it, count the species, and measure an abiotic factor at each quadrat, such as light intensity with a light meter. Repeat with more transects and calculate means.

Variables: independent: position along the transect (or the abiotic factor); dependent: number or percentage cover of the species; control: quadrat size, counting rule, time of the readings.

Safety: stay away from deep water, wear gloves near nettles or thorns, and wash your hands afterwards.

Typical results: along a transect from a tree into a field, light intensity rises and plants such as daisies become more common away from the shade.

Errors: choosing where to put quadrats (bias); too few quadrats; counting plants on the edge differently each time.

Mean, median and mode

A student counted clover plants in 9 random quadrats: 6, 2, 9, 4, 6, 0, 3, 6, 5.

Mean: \(\dfrac{6 + 2 + 9 + 4 + 6 + 0 + 3 + 6 + 5}{9} = \dfrac{41}{9} \approx 4.6\) plants per quadrat (2 significant figures)

In order: 0, 2, 3, 4, 5, 6, 6, 6, 9, so the median is the 5th value: 5

Mode: 6 appears three times, so the mode is 6

Estimating a population

A meadow is 60 m long and 45 m wide. Quadrats 50 cm \(\times\) 50 cm placed at random held a mean of 3.0 cowslips each. Estimate the number of cowslips in the meadow.

Area of one quadrat: \(0.5 \times 0.5 = 0.25\text{ m}^2\)

Mean per m²: \(3.0 \div 0.25 = 12\) cowslips per m²

Area of meadow: \(60 \times 45 = 2700\text{ m}^2\)

Population: \(12 \times 2700 = 32\,400\) cowslips

Common mistakes

  • Drawing food chain arrows the wrong way. The arrow points to the organism that eats.
  • Saying plants get their food from the soil. Producers make glucose by photosynthesis; the soil gives only water and mineral ions.
  • Defining a predator as "an animal that eats other organisms". That includes herbivores; a predator kills and eats other animals.
  • Multiplying the mean per quadrat by the field area when the quadrat is not 1 m². Convert to a mean per m² first.
  • Throwing a quadrat over your shoulder. It is not truly random; use coordinates from random numbers.

Exam tip

For predator-prey graphs, describe the pattern with numbers (how often the peaks come, and the delay), then explain it as a cycle using "more food, so more survive and breed". Six-mark sampling methods score for random coordinates, many quadrats, a mean, and scaling up by the area.

Study Helper Hints first, answers after you try

Stuck on this one? Ask for a hint and I’ll point you in the right direction, without giving the answer away. Once you’ve checked your answer, I’ll show you how the marks are awarded.