Level:
Correct: 0
Incorrect: 0
Marks: 0/0
Exam Practice
Course:
Topics:
OCR GCSE Biology (Paper 3) Smart practice A mixed round aimed at your weak spots
Avg
score:
–
Topics
done:
0/29

Maintaining internal environments and blood sugar control

Practise 16 exam-style questions on Maintaining internal environments and blood sugar control for OCR GCSE Biology (Paper 3). Write your answer as you would in the exam and get it marked in seconds against the mark scheme, point by point, with the Study Helper on hand if you get stuck.

  • 16 questions
  • 1–6 marks each
  • Instant marking
  • No sign-up needed
16 questions, marked as you go

Sample questions with model answers

Here are 4 of the questions in this topic, each with a model answer, an explanation of why it earns the marks and the mark scheme an examiner would use.

Question 1

1 mark

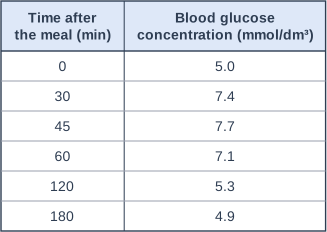
A scientist measured the blood glucose concentration of a volunteer at different times after a meal.

The table shows the results.

Between which two times was the mean rate of decrease in blood glucose concentration greatest?

Choose your answer.

  • A 30 and 45 minutes
  • B 45 and 60 minutes
  • C 60 and 120 minutes
  • D 120 and 180 minutes
Table with columns "Time after the meal (min)", "Blood glucose concentration (mmol/dm³)". Time after the meal (min): 0; Blood glucose concentration (mmol/dm³): 5.0 | Time after the meal (min): 30; Blood glucose concentration (mmol/dm³): 7.4 | Time after the meal (min): 45; Blood glucose concentration (mmol/dm³): 7.7 | Time after the meal (min): 60; Blood glucose concentration (mmol/dm³): 7.1 | Time after the meal (min): 120; Blood glucose concentration (mmol/dm³): 5.3 | Time after the meal (min): 180; Blood glucose concentration (mmol/dm³): 4.9.

Model answer

B (45 and 60 minutes)

Mean rate of decrease = decrease ÷ time:
45 to 60 minutes: 0.6 ÷ 15 = 0.040 mmol/dm³ per minute
60 to 120 minutes: 1.8 ÷ 60 = 0.030 mmol/dm³ per minute
120 to 180 minutes: 0.4 ÷ 60 = 0.0067 mmol/dm³ per minute

Explanation

A rate is the change divided by the time taken, so intervals of different lengths cannot be compared just by the size of the change. The biggest fall (1.8 mmol/dm³) was between 60 and 120 minutes, but it was spread over 60 minutes, so its mean rate was lower than the 15-minute interval from 45 to 60 minutes. Choosing C is the common slip.

Mark scheme
  1. 1 mark

    B / 45 and 60 minutes

    The only correct answer is B: the concentration fell by 0.6 mmol/dm³ in 15 minutes, a mean rate of 0.040 mmol/dm³ per minute. A is not correct because the concentration rose between 30 and 45 minutes; C is not correct because although the fall was largest (1.8 mmol/dm³) it took 60 minutes, a mean rate of only 0.030 mmol/dm³ per minute; D is not correct because the fall of 0.4 mmol/dm³ in 60 minutes is a mean rate of about 0.0067 mmol/dm³ per minute. ALLOW the letter or the option. If more than one option is given, do not award the mark.
Question 2

2 marks

Two students are discussing what happens when the pancreas releases insulin.

Student A says: 'The insulin travels to the liver and is changed into glycogen there.'

Student B says: 'The insulin breaks the glucose in the blood down into smaller molecules.'

Both students are wrong. Explain what insulin actually does to bring a high blood glucose concentration back down.

Model answer

Insulin is a hormone: it is a signal, so it is not changed into anything itself and it does not break glucose down. It causes liver and muscle cells to take up glucose from the blood. Inside these cells the glucose molecules are joined together to make glycogen, which is stored, so the blood glucose concentration falls.

Explanation

Insulin is released by the pancreas when blood glucose is high and acts on its target cells, which take up glucose and build it into the large storage molecule glycogen. So it is glucose, not insulin, that becomes glycogen, and glucose is built up rather than broken down. Mixing up these ideas is a very common error.

Mark scheme
  1. 1 mark

    insulin acts as a (chemical) signal / hormone that causes liver / muscle cells to take up glucose from the blood

    ALLOW insulin makes cells absorb glucose from the blood. ALLOW insulin binds to receptors on liver / muscle cells, which then take in glucose. IGNORE insulin is made in the pancreas.

  2. 1 mark

    insulin causes (the liver / muscle cells to convert) glucose into glycogen, which is stored

    ALLOW glucose molecules are joined together to make glycogen. DO NOT ALLOW insulin is converted into glycogen / insulin breaks glucose down into glycogen / glucose is converted into glucagon.

Question 3

3 marks

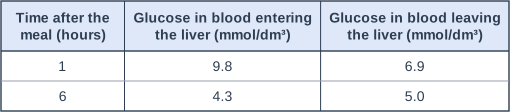
Blood from the small intestine travels to the liver in a blood vessel. A scientist measured the glucose concentration of the blood in this vessel (blood entering the liver) and in the blood vessel leaving the liver.

The measurements were made 1 hour after a meal and 6 hours after the meal.

The table shows the results.

Explain the differences between the blood entering the liver and the blood leaving the liver at these two times.

Table with columns "Time after the meal (hours)", "Glucose in blood entering the liver (mmol/dm³)", "Glucose in blood leaving the liver (mmol/dm³)". Time after the meal (hours): 1; Glucose in blood entering the liver (mmol/dm³): 9.8; Glucose in blood leaving the liver (mmol/dm³): 6.9 | Time after the meal (hours): 6; Glucose in blood entering the liver (mmol/dm³): 4.3; Glucose in blood leaving the liver (mmol/dm³): 5.0.

Model answer

One hour after the meal, glucose absorbed from the small intestine makes the blood entering the liver very high in glucose (9.8 mmol/dm³), but the blood leaving has only 6.9 mmol/dm³, so the liver is removing glucose. This is because insulin causes the liver cells to take up glucose and convert it into glycogen. Six hours after the meal the blood leaving the liver has more glucose (5.0 mmol/dm³) than the blood entering it (4.3 mmol/dm³), so the liver is adding glucose to the blood. This is because glucagon causes the liver cells to convert their glycogen back into glucose, which is released into the blood.

Explanation

Compare the two columns at each time: a fall across the liver means the liver is taking glucose out, a rise means it is putting glucose in. Link each change to the hormone that causes it: insulin when blood glucose is high after a meal, glucagon when it is low long after a meal. Good answers quote the figures and keep glucose, glycogen and glucagon distinct.

Mark scheme
  1. 1 mark

    1 hour after the meal the blood leaving the liver contains less glucose than the blood entering (6.9 compared with 9.8 mmol/dm³) / the liver removes glucose from the blood

    max 3. Max 2 if neither insulin nor glucagon is named. ALLOW the liver takes up 2.9 mmol/dm³ of glucose.

  2. 1 mark

    because insulin causes liver cells to take up glucose and convert it into glycogen (to be stored)

    DO NOT ALLOW insulin breaks down glucose / insulin is converted into glycogen.

  3. 1 mark

    6 hours after the meal the blood leaving the liver contains more glucose than the blood entering (5.0 compared with 4.3 mmol/dm³) / the liver adds glucose to the blood

    ALLOW the liver releases 0.7 mmol/dm³ of glucose into the blood.

  4. 1 mark

    because glucagon causes liver cells to convert glycogen into glucose, which is released into the blood

    DO NOT ALLOW glucagon is converted into glucose / glucagon breaks down glucose.

Question 4

4 marks

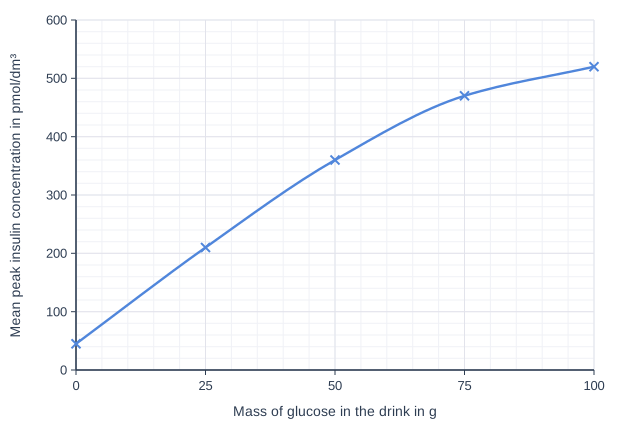
A scientist gave a group of volunteers drinks containing different masses of glucose on different days. After each drink, the highest (peak) concentration of insulin in each volunteer's blood was measured.

The graph shows the mean results.

Describe the relationship shown by the graph and explain it. Use data from the graph in your answer.

Line graph of mean peak insulin concentration in pmol/dm³ (y-axis, 0 to 600) against mass of glucose in the drink in g (x-axis, 0 to 100). The line is a smooth curve through (0, 45), (25, 210), (50, 360), (75, 470), (100, 520).

Model answer

As the mass of glucose in the drink increases, the peak insulin concentration increases, from 45 pmol/dm³ with no glucose to 520 pmol/dm³ with 100 g. The increase gets smaller at higher masses: it rises by 150 pmol/dm³ from 25 g to 50 g but by only 50 pmol/dm³ from 75 g to 100 g. A drink with more glucose means more glucose is absorbed into the blood, so the blood glucose concentration rises more. The pancreas detects this bigger rise and releases more insulin, because more insulin is needed to make the liver and muscle cells take up the extra glucose and convert it into glycogen.

Explanation

Describe the trend first, then show that the pattern is not a straight line by comparing the size of two increases. Then explain: the size of the insulin response depends on how high the blood glucose rises, which depends on how much glucose is absorbed. Answers that only say 'more glucose, more insulin' without data or a reason cannot get full marks.

Mark scheme
  1. 1 mark

    as the mass of glucose increases, the peak insulin concentration increases

    max 4. Max 3 if no data from the graph are used. ALLOW positive correlation.

  2. 1 mark

    but the increase gets smaller / the peak insulin concentration is not proportional to the mass of glucose (for example it rises by 150 pmol/dm³ from 25 g to 50 g but by only 50 pmol/dm³ from 75 g to 100 g)

    ALLOW the curve starts to level off. Data must be used for this mark: ALLOW any correct comparison of two increases from the graph.

  3. 1 mark

    (with more glucose) more glucose is absorbed into the blood, so the blood glucose concentration rises more

    IGNORE more sugar in the body.

  4. 1 mark

    the pancreas detects the (larger) rise in blood glucose and releases more insulin

    DO NOT ALLOW the liver releases insulin.

  5. 1 mark

    more insulin is needed to cause cells to take up more glucose / to convert more glucose into glycogen (to return blood glucose to normal)

    DO NOT ALLOW insulin breaks down glucose.

Ready to try the rest? Every answer you write is marked against the mark scheme, so you can see exactly where the marks are.

Study Helper Hints first, answers after you try

Stuck on this one? Ask for a hint and I’ll point you in the right direction, without giving the answer away. Once you’ve checked your answer, I’ll show you how the marks are awarded.