Level:
Correct: 0
Incorrect: 0
Marks: 0/0
Exam Practice
Course:
Topics:
AQA GCSE Economics (Paper 2) Smart practice A mixed round aimed at your weak spots
Unit 1
Introduction to the national economy
Interest rates, saving, borrowing, spending and investment
Government income and expenditure
Unit 2
Government objectives
Economic objectives of the government
Economic growth
Economic growth
Employment and unemployment
Inflation and price stability
Balance of payments
Balance of payments
Unit 3
How the government manages the economy
Fiscal policy
Fiscal policy
Monetary policy
Monetary policy
Supply-side policies
Policies to correct positive and negative externalities
Policies to correct externalities
Unit 4
International trade and the global economy
Why countries trade and the importance of international trade to the UK
Why countries trade
Exchange rates
Exchange rates
Free-trade agreements including the European Union
Free-trade agreements including the EU
Globalisation: benefits and drawbacks
Unit 5
The role of money and financial markets
The role of money
The role of money
The role and importance of the financial sector for the economy
The role and importance of the financial sector
Avg
score:
–
Topics
done:
0/18

Policies to correct externalities

Practise 16 exam-style questions on Policies to correct externalities for AQA GCSE Economics (Paper 2). Write your answer as you would in the exam and get it marked in seconds against the mark scheme, point by point, with the Study Helper on hand if you get stuck.

  • 16 questions
  • 1–15 marks each
  • Instant marking
  • No sign-up needed
16 questions, marked as you go

Sample questions with model answers

Here are 4 of the questions in this topic, each with a model answer, an explanation of why it earns the marks and the mark scheme an examiner would use.

Question 1

1 mark

Home insulation creates positive externalities because it reduces energy use and the pollution caused by heating homes.

Which of the following policies is most likely to increase the number of homes that are insulated?

Choose your answer.

  • A A grant (subsidy) that pays part of the cost of insulating a home
  • B A tax on insulation materials
  • C A minimum price for insulation
  • D A limit on the number of firms allowed to fit insulation

Model answer

A A grant (subsidy) that pays part of the cost of insulating a home

Explanation

A good with positive externalities is under-consumed in a free market because buyers ignore the benefits to third parties, such as less pollution. A grant lowers the price that households pay, so more homes are insulated, moving consumption towards the level that is best for society. Taxes, minimum prices and limits on firms would all push consumption the wrong way.

Mark scheme
  1. 1 mark

    A / A grant (subsidy) that pays part of the cost of insulating a home

    accept the letter or the option text. B, C and D would all raise the price of insulation or reduce its supply, so fewer homes would be insulated. If more than one option is given, 0 marks.

Question 2

2 marks

Explain one disadvantage of using an indirect tax to reduce the consumption of sugary drinks.

Model answer

A tax on sugary drinks is regressive. Low-income households spend a larger share of their income on food and drink, so the higher price takes a bigger proportion of their income than it does from high-income households. This makes them worse off and widens inequality, even though the aim of the tax is to improve health.

Explanation

Identify a disadvantage (regressive, inelastic demand, switching to untaxed sugar, the difficulty of setting the rate) and explain the consequence. Note that the UK's Soft Drinks Industry Levy, introduced in 2018, is paid by producers, many of whom cut the sugar in their drinks to avoid it, so a tax can also work by changing what firms make.

Mark scheme
  1. 1 mark

    Identifies a valid disadvantage, e.g. the tax is regressive: it takes a larger share of income from low-income households / demand may be price inelastic, so consumption falls only a little / consumers switch to other sugary products that are not taxed / it is hard to set the tax at the right level because the external cost is hard to measure / people may buy untaxed drinks elsewhere / jobs may be lost in the soft drinks industry

    AQA marking: 2 = explained, 1 = identified, 0 = nothing worthy of credit. This indicative content is not exhaustive: credit any valid point, not only the listed ones. The disadvantage must relate to using a tax. 'It makes drinks more expensive' alone scores 0, since that is the aim of the tax.

  2. 1 mark

    Explains it: develops the point with a linked reason / consequence, e.g. low-income households spend a larger proportion of their income on such drinks, so the tax takes a bigger share of their income than of richer households' income, which increases inequality; or if many consumers are in the habit of buying sugary drinks, demand is price inelastic, so the price rises but consumption falls only slightly and the health costs to others hardly change; or people may switch to sweets or cakes instead, so their sugar intake does not fall

    Award only if the point identified in the first mark is developed with a linked reason or consequence. Award marks for one point only: if more than one is given, credit the best one.

Question 3

3 marks

The government of Country X introduces a tax on sugary drinks, which raises their price by 8%. The price elasticity of demand (PED) for sugary drinks is -0.6. Before the tax, 50 million litres of sugary drinks were sold each week.

Calculate the expected quantity of sugary drinks sold each week after the tax. Give your answer in millions of litres.

Model answer

PED = % change in quantity demanded ÷ % change in price
so % change in quantity demanded = PED × % change in price = -0.6 × 8 = -4.8%

Fall in quantity = 4.8% × 50 million = 2.4 million litres

Quantity after the tax = 50 - 2.4 = 47.6 million litres a week

Explanation

Rearrange PED = %ΔQd ÷ %ΔP to get %ΔQd = PED × %ΔP, which gives a 4.8% fall. Because demand is price inelastic (PED between 0 and -1), an 8% price rise cuts consumption by less than 8%, so the tax reduces the negative externalities only modestly but raises a lot of revenue. Dividing instead of multiplying (13.3%) is the most common error.

Mark scheme
  1. 1 mark

    Percentage change in quantity demanded = PED × percentage change in price = -0.6 × 8 = -4.8%; or a correct final answer of 47.6 million litres with no working

    An answer of 47.6 million litres with no working scores 3 marks.

  2. 1 mark

    Fall in quantity = 4.8% of 50 million = 2.4 million litres

    Own figure rule: a wrong percentage correctly applied to 50 million earns this mark.

  3. 1 mark

    47.6 million litres

    Accept 47.6 or 47,600,000 litres. Common errors: 2.4 million litres (only the fall given) scores 2 marks; 43.3 million litres (8 ÷ 0.6 = 13.3%, the formula rearranged wrongly) scores 1 mark (own figure rule on the second step); 45.2 million litres (4.8 million litres subtracted instead of 4.8%) scores 1 mark for the -4.8%.

Question 4

9 marks

In 2019 the government of Country X introduced a sugar tax of 25p per litre on soft drinks containing more than 5g of sugar per 100ml. The tax is paid by the producers of the drinks, and the revenue is spent on sport in schools. The aim of the tax is to reduce obesity and the costs it creates for the health service, which are paid for by taxpayers.

Many producers reduced the sugar in their drinks so that the drinks were no longer taxed. However, some doctors point out that children also get sugar from sweets, cakes and other foods, which are not taxed.

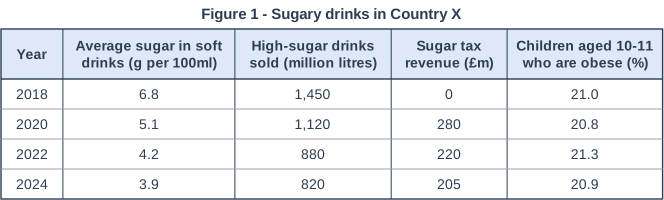
Figure 1 shows data for Country X from 2018 to 2024.

Using Figure 1, assess whether the sugar tax has been successful in reducing the negative externalities caused by sugary drinks.

Figure 1 - Sugary drinks in Country X. Table with columns "Year", "Average sugar in soft drinks (g per 100ml)", "High-sugar drinks sold (million litres)", "Sugar tax revenue (£m)", "Children aged 10-11 who are obese (%)". Year: 2018; Average sugar in soft drinks (g per 100ml): 6.8; High-sugar drinks sold (million litres): 1,450; Sugar tax revenue (£m): 0; Children aged 10-11 who are obese (%): 21.0 | Year: 2020; Average sugar in soft drinks (g per 100ml): 5.1; High-sugar drinks sold (million litres): 1,120; Sugar tax revenue (£m): 280; Children aged 10-11 who are obese (%): 20.8 | Year: 2022; Average sugar in soft drinks (g per 100ml): 4.2; High-sugar drinks sold (million litres): 880; Sugar tax revenue (£m): 220; Children aged 10-11 who are obese (%): 21.3 | Year: 2024; Average sugar in soft drinks (g per 100ml): 3.9; High-sugar drinks sold (million litres): 820; Sugar tax revenue (£m): 205; Children aged 10-11 who are obese (%): 20.9.

Model answer

The sugar tax has clearly changed what is sold. Figure 1 shows that the average sugar content of soft drinks fell from 6.8g per 100ml in 2018 to 3.9g in 2024, about 43%, and sales of high-sugar drinks fell from 1,450 million to 820 million litres, also about 43%. Because the tax is paid by producers, many reduced the sugar in their drinks to get below the 5g limit and avoid it, so consumers now take in much less sugar from drinks. Less sugar should, over time, mean less obesity, diabetes and tooth decay, which reduces the costs that fall on the health service and on taxpayers: the negative externality. The tax also raises revenue, £205 million in 2024, which is spent on school sport and so helps children's health further.

However, the final aim is to reduce obesity, and Figure 1 shows little sign of that. The share of children aged 10-11 who are obese was 21.0% in 2018 and still 20.9% in 2024, and it even rose to 21.3% in 2022. One reason is that children also get sugar from sweets, cakes and other foods that are not taxed, so they may have replaced some of the sugar from drinks. Obesity also depends on exercise and diet as a whole, and health improvements take many years to appear, so the external costs of obesity may not yet have fallen. The tax is also regressive, taking more of the income of poorer households, and as the tax works the revenue falls (from £280 million in 2020 to £205 million in 2024), leaving less money for school sport.

Overall, I think the sugar tax has been successful at its direct aim of cutting the sugar in soft drinks, but it is too early to say that it has reduced the negative externalities of obesity, because the obesity rate has hardly changed. Whether it succeeds depends on the time allowed and on other policies: on its own it is not enough, and it would work better alongside measures on sugary foods, limits on advertising to children and information campaigns.

Explanation

Strong answers separate the direct effect (much less sugar in drinks and fewer high-sugar drinks sold) from the final aim (lower obesity and lower health service costs), use the figures for both, and reach a judgement that explains what success depends on. Answers that only describe the table, or argue that the tax 'worked' without noticing the obesity column, cannot reach Level 3.

Mark scheme
  1. 9 marks

    Levels of response (9 marks).
    Level 3 (7-9 marks): A fully justified conclusion with sustained evaluation, which is coherent and relevant, with judgements supported by evidence. A full analysis of the economic evidence, a well-developed and logical chain of reasoning. Comprehensive application of knowledge and understanding of pertinent concepts/issues relevant to the context; specialist language used throughout.
    Level 2 (4-6 marks): A partially justified conclusion with an evaluation, which is mostly coherent and relevant; judgements may not be fully supported by evidence. An incomplete analysis of the economic evidence; starts to develop a chain of reasoning. Good application of knowledge and understanding of concepts/issues mostly relevant to the context; specialist language used mostly appropriately.
    Level 1 (1-3 marks): A basic conclusion or assertion may be present based on evaluative judgements supported by little or no evidence. Analysis of discrete points of the economic evidence with no chain of reasoning attempted. Basic application of knowledge and understanding of concepts/issues with limited relevance to the context; may use non-specialist language.
    0 marks: Nothing written worthy of credit.

    Max 6 if the answer considers only one side or gives no judgement. Max 6 if the answer makes no use of the figure/data given. Indicative content (not exhaustive; credit other valid points): Successful: producers reformulated drinks: average sugar fell from 6.8g to 3.9g per 100ml (about 43%); high-sugar drinks sold fell from 1,450 to 820 million litres (about 43%), so far less sugar is consumed from drinks; less sugar means lower risk of obesity, diabetes and tooth decay in the long run, so lower external costs for the health service and taxpayers; revenue (£205m in 2024) funds school sport, which also improves health; the tax changed producers' behaviour without banning anything; falling revenue (280 to 205) shows consumption of taxed drinks falling. Not successful / limits: child obesity barely changed (21.0% in 2018, 20.9% in 2024, and it rose to 21.3% in 2022), so the external costs of obesity may not have fallen; children may get sugar from untaxed foods; obesity has many causes (diet, exercise); health effects take many years (time lags); the tax is regressive; falling revenue means less money for school sport. Use of data: the sugar, sales, revenue and obesity columns. Overall: a justified judgement, e.g. successful at its direct aim of cutting sugar in drinks, but not yet shown to reduce obesity and its external costs; it depends on the time period, on other sources of sugar and on complementary policies (taxes or rules on sugary foods, advertising limits, information campaigns).

Ready to try the rest? Every answer you write is marked against the mark scheme, so you can see exactly where the marks are.

Study Helper Hints first, answers after you try

Stuck on this one? Ask for a hint and I’ll point you in the right direction, without giving the answer away. Once you’ve checked your answer, I’ll show you how the marks are awarded.