Level:
Correct: 0
Incorrect: 0
Marks: 0/0
Exam Practice
Course:
Topics:
AQA GCSE Economics (Paper 2) Smart practice A mixed round aimed at your weak spots
Unit 1
Introduction to the national economy
Interest rates, saving, borrowing, spending and investment
Government income and expenditure
Unit 2
Government objectives
Economic objectives of the government
Economic growth
Economic growth
Employment and unemployment
Inflation and price stability
Balance of payments
Balance of payments
Unit 3
How the government manages the economy
Fiscal policy
Fiscal policy
Monetary policy
Monetary policy
Supply-side policies
Policies to correct positive and negative externalities
Policies to correct externalities
Unit 4
International trade and the global economy
Why countries trade and the importance of international trade to the UK
Why countries trade
Exchange rates
Exchange rates
Free-trade agreements including the European Union
Free-trade agreements including the EU
Globalisation: benefits and drawbacks
Unit 5
The role of money and financial markets
The role of money
The role of money
The role and importance of the financial sector for the economy
The role and importance of the financial sector
Avg
score:
–
Topics
done:
0/18

Economic objectives of the government

Practise 14 exam-style questions on Economic objectives of the government for AQA GCSE Economics (Paper 2). Write your answer as you would in the exam and get it marked in seconds against the mark scheme, point by point, with the Study Helper on hand if you get stuck.

  • 14 questions
  • 1–15 marks each
  • Instant marking
  • No sign-up needed
14 questions, marked as you go

Sample questions with model answers

Here are 4 of the questions in this topic, each with a model answer, an explanation of why it earns the marks and the mark scheme an examiner would use.

Question 1

1 mark

The government of Country X has four targets:

economic growth of at least 2% a year
an unemployment rate below 5%
CPI inflation between 1% and 3%
a current account deficit no larger than 2% of GDP.

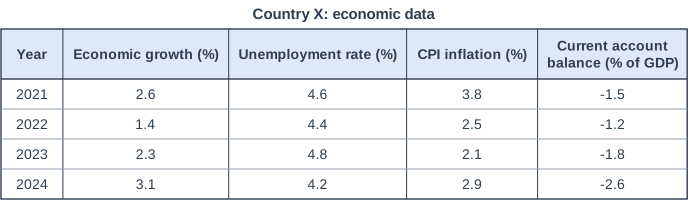
Figure 1 shows data for Country X. A negative current account balance is a deficit.

In which year did Country X meet all four of its targets?

Choose your answer.

  • A 2021
  • B 2022
  • C 2023
  • D 2024
Country X: economic data. Table with columns "Year", "Economic growth (%)", "Unemployment rate (%)", "CPI inflation (%)", "Current account balance (% of GDP)". Year: 2021; Economic growth (%): 2.6; Unemployment rate (%): 4.6; CPI inflation (%): 3.8; Current account balance (% of GDP): -1.5 | Year: 2022; Economic growth (%): 1.4; Unemployment rate (%): 4.4; CPI inflation (%): 2.5; Current account balance (% of GDP): -1.2 | Year: 2023; Economic growth (%): 2.3; Unemployment rate (%): 4.8; CPI inflation (%): 2.1; Current account balance (% of GDP): -1.8 | Year: 2024; Economic growth (%): 3.1; Unemployment rate (%): 4.2; CPI inflation (%): 2.9; Current account balance (% of GDP): -2.6.

Model answer

C 2023

Explanation

In 2023 growth was 2.3% (at least 2%), unemployment 4.8% (below 5%), inflation 2.1% (between 1% and 3%) and the current account deficit 1.8% of GDP (no larger than 2%), so all four targets were met. In 2021 inflation (3.8%) was above the range, in 2022 growth (1.4%) was too low, and in 2024 the current account deficit (2.6% of GDP) was too large. Check every target in turn rather than looking only at growth.

Mark scheme
  1. 1 mark

    C / 2023

    accept the letter or the option text. If more than one option is given, 0 marks.

Question 2

2 marks

Explain what is meant by full employment.

Model answer

Full employment is when everyone who is willing and able to work at the current wage rate can find a job. It does not mean zero unemployment, because there will always be some people who are briefly between jobs.

Explanation

The key words are 'willing and able to work' at the going wage: people who do not want a job, or cannot work, are not unemployed. For 2 marks you need to show that full employment still allows a small amount of short-term (frictional) unemployment. 'Everyone has a job' is only a partial answer.

Mark scheme
  1. 1 mark

    A situation where (nearly) everyone has a job / a very low level of unemployment

    Partial explanation (1 mark), e.g. 'when everyone has a job', 'very low unemployment', 'no unemployment'.

  2. 1 mark

    Completes it: everyone who is willing and able to work (who wants a job) at the current wage rate can find one / the only unemployment is short-term (frictional) unemployment as people move between jobs

    Complete explanation (2 marks), e.g. 'when everyone who is willing and able to work at the going wage rate has a job'; 'when everyone who wants a job has one'; 'when nearly all people have jobs, so the only unemployment is people briefly between jobs'. 'Zero unemployment' does not earn this mark: full employment allows some short-term unemployment. An example alone (e.g. '3% unemployment') scores 0.

Question 3

2 marks

Explain one way in which policies to reduce inequality could conflict with achieving economic growth.

Model answer

To reduce inequality, the government might raise the top rate of income tax. This reduces the reward for extra work, so some highly paid and skilled workers may choose to work fewer hours, not set up businesses or move abroad. This reduces the economy's output and could slow economic growth.

Explanation

Redistribution usually means taxing high earners or wealth more and spending more on benefits. The conflict comes through incentives: if people and firms keep less of what they earn, they may work, invest or start businesses less, so growth slows. Not every economist agrees on how large this effect is, but for 2 marks the link must be explained clearly.

Mark scheme
  1. 1 mark

    Identifies a valid policy and effect, e.g. higher income tax rates on high earners reduce the reward for working / higher taxes on profits or wealth reduce the reward for investing or starting a business / more generous benefits may reduce the incentive to look for work / skilled workers or entrepreneurs may move abroad

    2 = explained, 1 = identified, 0 = nothing worthy of credit. Possible answers include the links listed. This indicative content is not exhaustive: credit any valid link. The answer must link a policy to reduce inequality to an effect on growth.

  2. 1 mark

    Explains it: develops the point with a linked consequence, e.g. people work fewer hours or avoid promotion, so output falls / firms invest less in new capital and fewer businesses start, so the economy's productive capacity grows more slowly / fewer people in work means less output, so growth slows

    Examples of 2-mark answers: 'Raising the top rate of income tax reduces the reward for working (1), so some high earners may work less or move abroad, reducing output and growth (1).' 'Higher taxes on business profits leave firms with less reward for investing (1), so they buy less new machinery and the economy grows more slowly (1).'

Question 4

9 marks

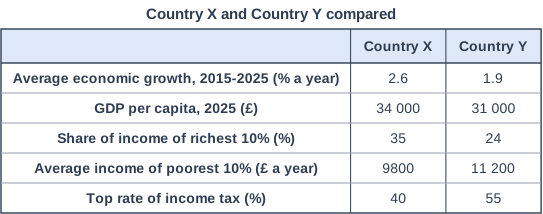
Country X has a top rate of income tax of 40% and low welfare benefits. Its neighbour, Country Y, has a higher top rate of income tax and more generous benefits for low-income families. Figure 1 compares the two countries.

The government of Country X is considering raising its top rate of income tax and using the extra revenue to increase benefits for low-income families. Some economists warn that this would reduce the incentive to work, invest and start businesses, and that some highly paid workers might move abroad. Others argue that high inequality causes social problems and that growth is of little use to people who do not share in it.

Using Figure 1, assess whether the government of Country X should make reducing inequality a higher priority than economic growth.

Country X and Country Y compared. Table with columns (row headings), "Country X", "Country Y". Average economic growth, 2015-2025 (% a year); Country X: 2.6; Country Y: 1.9 | GDP per capita, 2025 (£); Country X: 34 000; Country Y: 31 000 | Share of income of richest 10% (%); Country X: 35; Country Y: 24 | Average income of poorest 10% (£ a year); Country X: 9800; Country Y: 11 200 | Top rate of income tax (%); Country X: 40; Country Y: 55.

Model answer

Figure 1 suggests that Country X's faster growth has not benefited everyone. Country X has grown by 2.6% a year since 2015, faster than Country Y's 1.9%, and its GDP per capita is about 9.7% higher (£34 000 against £31 000). Yet the poorest 10% of people in Country X have an average income of only £9800, about 12.5% less than the £11 200 received by the poorest 10% in Country Y. The richest 10% in Country X receive 35% of all income, compared with 24% in Country Y. This shows that a higher average income can hide large differences: many of the gains from growth in Country X have gone to people at the top. High inequality can lead to poverty, poorer health and lower educational achievement for children from low-income families, as well as crime and social tension. Raising the top rate of tax to pay for higher benefits would raise the incomes of the poorest families, and because they spend most of any extra income, it would also support demand for local businesses.

However, there is a real risk of conflict with economic growth. A higher top rate of income tax reduces the reward for working longer hours, taking promotion, investing or starting a business. Some highly skilled workers, such as doctors and engineers, might move abroad, which would reduce the economy's productive capacity and the government's tax revenue. Over ten years, growth of 2.6% a year raises output by about 29%, compared with about 21% at 1.9% a year, so slower growth would mean lower incomes and less tax revenue to pay for the public services that low-income families rely on. More generous benefits could also reduce the incentive for some people to look for work.

Overall, I think Country X should give reducing inequality a higher priority than it does now, because the data show that its faster growth has left the poorest 10% worse off than the poorest in Country Y. However, it should not ignore growth: a modest rise in the top tax rate, with the revenue targeted at low-income families and at education and training, is less likely to damage incentives than a large one. The right balance depends on how strongly high earners respond to higher taxes, how well the extra revenue is spent, and on other differences between the two countries that Figure 1 does not show.

Explanation

This question tests the conflict between reducing inequality and economic growth. A Level 3 answer uses Figure 1 to show both sides - Country X's faster growth and higher GDP per capita, but its higher inequality and poorer bottom 10% - explains the incentive effects of higher taxes and benefits, and reaches a judgement that says what it depends on. Answers that use only one side of the data, or none of it, cannot go above 6 marks.

Mark scheme
  1. 9 marks

    Levels of response (9 marks).
    Level 3 (7-9 marks): A fully justified conclusion with sustained evaluation, which is coherent and relevant, with judgements supported by evidence. A full analysis of the economic evidence, a well-developed and logical chain of reasoning. Comprehensive application of knowledge and understanding of pertinent concepts/issues relevant to the context; specialist language used throughout.
    Level 2 (4-6 marks): A partially justified conclusion with an evaluation, which is mostly coherent and relevant; judgements may not be fully supported by evidence. An incomplete analysis of the economic evidence; starts to develop a chain of reasoning. Good application of knowledge and understanding of concepts/issues mostly relevant to the context; specialist language used mostly appropriately.
    Level 1 (1-3 marks): A basic conclusion or assertion may be present based on evaluative judgements supported by little or no evidence. Analysis of discrete points of the economic evidence with no chain of reasoning attempted. Basic application of knowledge and understanding of concepts/issues with limited relevance to the context; may use non-specialist language.
    0 marks: Nothing written worthy of credit.

    Max 6 if the answer considers only one side or gives no judgement. Max 6 if the answer makes no use of the figure/data given. Indicative content (not exhaustive; credit other valid points). For (prioritise reducing inequality): the richest 10% receive 35% of income in Country X against 24% in Country Y; the poorest 10% in Country Y have a higher average income (£11 200 against £9800, about 14.3% more) even though Country Y has grown more slowly and has a lower GDP per capita, so faster growth in Country X has not reached the poorest; inequality is linked to poverty, poorer health and education, crime and social tension; low-income households spend a larger share of extra income, supporting demand; moral and ethical arguments about fairness; better-off families may be more able to invest in their children's education, so reducing poverty can raise future productivity. Against (prioritise growth): Country X has grown faster (2.6% a year against 1.9%), so over ten years its output rises by about 29% against about 21%, and its GDP per capita is about 9.7% higher (£34 000 against £31 000); higher taxes on top earners reduce incentives to work, invest and start businesses, and some skilled workers may emigrate (brain drain), slowing growth and reducing tax revenue; growth raises tax revenue that can pay for public services which help low-income families; more generous benefits may reduce the incentive for some people to look for work; growth creates jobs, which is often the best route out of poverty. Use of data: comparisons from Figure 1, including the poorest 10%'s income and GDP per capita (percentage differences), growth rates and the top tax rates. Overall: a top answer judges, e.g., that some reduction in inequality is justified because the poorest are better off in Country Y despite slower growth, but that the size of the tax rise matters; and says what it depends on (how strongly people respond to higher taxes, how the revenue is spent, whether growth would otherwise reach low-income households, other differences between the countries).

Ready to try the rest? Every answer you write is marked against the mark scheme, so you can see exactly where the marks are.

Study Helper Hints first, answers after you try

Stuck on this one? Ask for a hint and I’ll point you in the right direction, without giving the answer away. Once you’ve checked your answer, I’ll show you how the marks are awarded.