Level:
Correct: 0
Incorrect: 0
Marks: 0/0
Exam Practice
Course:
Topics:
AQA GCSE Economics (Paper 2) Smart practice A mixed round aimed at your weak spots
Unit 1
Introduction to the national economy
Interest rates, saving, borrowing, spending and investment
Government income and expenditure
Unit 2
Government objectives
Economic objectives of the government
Economic growth
Economic growth
Employment and unemployment
Inflation and price stability
Balance of payments
Balance of payments
Unit 3
How the government manages the economy
Fiscal policy
Fiscal policy
Monetary policy
Monetary policy
Supply-side policies
Policies to correct positive and negative externalities
Policies to correct externalities
Unit 4
International trade and the global economy
Why countries trade and the importance of international trade to the UK
Why countries trade
Exchange rates
Exchange rates
Free-trade agreements including the European Union
Free-trade agreements including the EU
Globalisation: benefits and drawbacks
Unit 5
The role of money and financial markets
The role of money
The role of money
The role and importance of the financial sector for the economy
The role and importance of the financial sector
Avg
score:
–
Topics
done:
0/18

Employment and unemployment

Practise 17 exam-style questions on Employment and unemployment for AQA GCSE Economics (Paper 2). Write your answer as you would in the exam and get it marked in seconds against the mark scheme, point by point, with the Study Helper on hand if you get stuck.

  • 17 questions
  • 1–15 marks each
  • Instant marking
  • No sign-up needed
17 questions, marked as you go

Sample questions with model answers

Here are 4 of the questions in this topic, each with a model answer, an explanation of why it earns the marks and the mark scheme an examiner would use.

Question 1

1 mark

Which of the following describes the claimant count measure of unemployment in the UK?

Choose your answer.

  • A The number of people without a job who have looked for work in the last four weeks and can start within two weeks, found from a survey of households
  • B The number of people claiming benefits mainly because they are unemployed
  • C The number of people of working age who are not in paid work
  • D The number of people who have been out of work for more than a year

Model answer

B The number of people claiming benefits mainly because they are unemployed

Explanation

The claimant count is taken from benefit records: it counts people claiming benefits mainly because they are unemployed (Jobseeker's Allowance, plus Universal Credit claimants who are required to look for work). Option A describes the Labour Force Survey (ILO) measure, which comes from a survey, not from benefit claims. Option C would wrongly include economically inactive people such as students and carers, and option D describes long-term unemployment.

Mark scheme
  1. 1 mark

    B / The number of people claiming benefits mainly because they are unemployed

    Accept the letter or the option text. If more than one option is given, 0 marks.
Question 2

2 marks

State two policies a government could use to reduce structural unemployment.

Model answer

1. Funding retraining courses and apprenticeships so that workers from declining industries gain the skills employers now need.
2. Giving grants or tax breaks to firms that set up in regions with high unemployment.

Explanation

Structural unemployment comes from a mismatch between workers' skills or location and the jobs that are available, so the policies that work improve skills (occupational mobility) or bring jobs and workers together (geographical mobility). Policies that simply raise spending in the whole economy, such as lower interest rates, mainly reduce cyclical unemployment, so they do not score here.

Mark scheme
  1. 2 marks

    1 mark for each different correct policy, max 2, e.g. funding retraining, education or apprenticeship schemes so that workers gain the skills employers need / grants, subsidies or lower taxes for firms that set up in areas of high unemployment (regional policy, enterprise zones) / relocation grants or help with housing costs so that workers can move to areas with vacancies / better transport links to areas of high unemployment

    1 mark for each different correct example, max 2. Possible answers; this indicative content is not exhaustive: credit other valid policies that tackle a mismatch between workers' skills or location and the jobs available. Two kinds of training (e.g. 'apprenticeships' and 'adult education courses') are the same policy: max 1. Do not accept policies that only raise total spending in the economy, such as lower interest rates, general tax cuts or 'more government spending' with no link to skills or location: these mainly reduce cyclical unemployment. Do not accept 'cut unemployment benefits' on its own (this targets frictional unemployment).

Question 3

2 marks

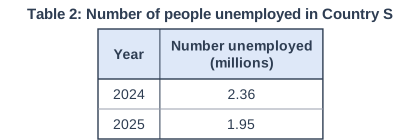
Table 2 shows the number of people unemployed in Country S (invented data).

Using Table 2, calculate the percentage fall in the number of people unemployed in Country S between 2024 and 2025. Give your answer to one decimal place.

Table 2: Number of people unemployed in Country S. Table with columns "Year", "Number unemployed (millions)". Year: 2024; Number unemployed (millions): 2.36 | Year: 2025; Number unemployed (millions): 1.95.

Model answer

Fall = 2.36 - 1.95 = 0.41 million
Percentage fall = 0.41 ÷ 2.36 × 100 = 17.37...%
= 17.4%

Explanation

A percentage change is always the change divided by the original (older) value, here the 2024 figure of 2.36 million. Dividing by the new value gives 21.0%, which only scores 1 mark, and so does an answer not given to one decimal place. The fall of 0.41 million is the change in the number, not a percentage.

Mark scheme
  1. 1 mark

    Correct method, e.g. (2.36 - 1.95) ÷ 2.36 × 100 / 0.41 ÷ 2.36 × 100; or a correct final answer of 17.4% with no working

    An answer of 17.4% (or -17.4%) with no working scores 2 marks. Accept with or without the % sign. Correct working but an incorrect final answer: 1 mark. Answer not to one decimal place but otherwise correct, e.g. 17% or 17.37%: 1 mark. Dividing by the 2025 figure instead of the 2024 figure (0.41 ÷ 1.95 × 100 = 21.0%): 1 mark. 0.41 million (the fall in the number, not a percentage) on its own: 0 marks.

  2. 1 mark

    Correct answer: 17.4% (accept a fall of 17.4% / -17.4%)

    Accept with or without the % sign.

Question 4

6 marks

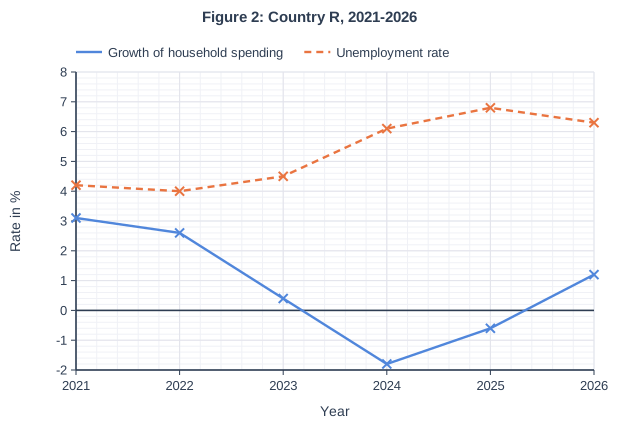
In 2023, falling consumer confidence and rising interest rates led households in Country R to cut back their spending. Figure 2 shows the annual growth of household spending and the unemployment rate in Country R between 2021 and 2026 (invented data).

Using Figure 2, analyse how the fall in household spending may have caused a rise in cyclical unemployment in Country R.

Figure 2: Country R, 2021-2026. Line graph of rate in % (y-axis, -2 to 8) against year (x-axis, 2021 to 2026). "Growth of household spending" joins the points (2021, 3.1), (2022, 2.6), (2023, 0.4), (2024, -1.8), (2025, -0.6), (2026, 1.2). "Unemployment rate" (dashed) joins the points (2021, 4.2), (2022, 4), (2023, 4.5), (2024, 6.1), (2025, 6.8), (2026, 6.3).

Model answer

Figure 2 shows that the growth of household spending in Country R slowed from 3.1% in 2021 to 0.4% in 2023, and spending actually fell in 2024 (-1.8%) and 2025 (-0.6%). When households spend less, firms sell fewer goods and services, so their sales revenue falls and unsold stock builds up. Firms respond by cutting output. Because the demand for labour is a derived demand - firms only employ workers to produce goods that people buy - they need fewer workers. They stop recruiting, cut hours and make some workers redundant, so unemployment rises. This is cyclical unemployment, because it is caused by a downturn in the economic cycle rather than by a change in one industry.

The effect then spreads. Workers who lose their jobs have much lower incomes, so they cut their own spending, which reduces the sales of other firms, which then cut jobs too. This knock-on effect helps to explain why unemployment rose from 4.0% in 2022 to 6.1% in 2024 and kept rising to 6.8% in 2025, even though spending was by then falling more slowly. There is also a time lag, because firms are slow to recruit again until they are confident that demand has recovered. Firms selling non-essential goods, such as restaurants and car dealers, are likely to have cut the most jobs, because households cut luxuries first.

The 2026 data supports this explanation: when household spending grew again, by 1.2%, unemployment began to fall, to 6.3%, which is what we would expect if most of the rise was cyclical.

Explanation

A top answer builds a chain of reasoning: less spending, lower sales, lower output, lower derived demand for labour, redundancies, then a knock-on effect as the newly unemployed spend less. It uses the figures from the graph, including the time lag in 2025 and the recovery in 2026. Answers that only say 'people spend less so unemployment rises' make a discrete point with no chain of reasoning and stay in Level 1.

Mark scheme
  1. 6 marks

    Levels of response (6 marks).
    Level 3 (5-6 marks): A full analysis of the economic evidence, a well-developed and logical chain of reasoning.
    Level 2 (3-4 marks): An incomplete analysis of the economic evidence, starts to develop a chain of reasoning. Good application of knowledge and understanding of concepts/issues mostly relevant to the context.
    Level 1 (1-2 marks): Analysis of discrete points of the economic evidence with no chain of reasoning attempted. Basic application of knowledge and understanding of concepts/issues with limited relevance to the context.
    0 marks: Nothing written worthy of credit.

    Max 4 if the answer makes no use of the evidence or context given. Levels are a ladder, as AQA instructs: an answer reaches Level 3 only if it also applies knowledge to the context, as Level 2 requires. Indicative content (not exhaustive; credit other valid points): households spend less, so firms sell fewer goods and services, their sales revenue falls and unsold stock builds up; firms cut output; the demand for labour is a derived demand, so firms need fewer workers; they stop recruiting, cut hours and make workers redundant, so unemployment rises; this is cyclical (demand-deficient) unemployment because it is caused by a downturn in the economic cycle, not by a change in one industry; workers who lose their jobs have lower incomes and spend less, so other firms' sales fall too and the job losses spread (a knock-on or multiplier effect); firms selling non-essential goods and services (e.g. restaurants, holidays, cars) are hit hardest; low confidence makes firms delay investment, adding to the fall in demand. Use of data: spending growth slowed from 3.1% in 2021 to 0.4% in 2023 and spending fell in 2024 (-1.8%) and 2025 (-0.6%); unemployment rose from 4.0% in 2022 to 6.1% in 2024 and peaked at 6.8% in 2025; unemployment kept rising in 2025 although spending was falling more slowly, showing a time lag (firms wait to see whether the fall in demand lasts and are slow to recruit again); when spending grew again in 2026 (1.2%), unemployment fell to 6.3%, as expected if the rise was cyclical. Level 3 answers develop a logical chain from lower spending to lower derived demand for labour to higher unemployment and use the data accurately.

Ready to try the rest? Every answer you write is marked against the mark scheme, so you can see exactly where the marks are.

Study Helper Hints first, answers after you try

Stuck on this one? Ask for a hint and I’ll point you in the right direction, without giving the answer away. Once you’ve checked your answer, I’ll show you how the marks are awarded.