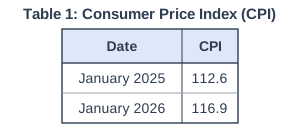
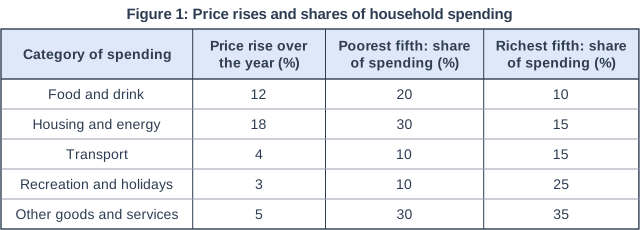
Figure 1 shows how much prices rose over a year in five categories of spending, and the share of spending on each category by the poorest fifth and the richest fifth of households in an economy (invented data). Over the same year, inflation measured by the Consumer Price Index (CPI) was 8.5%.
Using Figure 1, analyse why the rate of inflation measured by the CPI may not show how much the cost of living has risen for every household.
Model answer
The CPI measures the average change in the prices of a basket of goods and services, with each item weighted by how much the average household spends on it. Households whose spending is different from the average therefore experience a different rate of inflation.
Figure 1 shows that the prices of necessities rose fastest: housing and energy by 18% and food and drink by 12%. The poorest fifth of households spend half of their spending on these two categories (30% and 20%), compared with only a quarter for the richest fifth (15% and 10%). Because these are necessities, poorer households cannot easily cut back on them when their prices rise. So their cost of living rose by more than the CPI's 8.5%: weighting the price rises by their spending gives about 10.0%.
In contrast, the richest fifth spend 25% on recreation and holidays and 15% on transport, whose prices rose by only 3% and 4%. Their cost of living rose by about 7.0%, less than the CPI shows. So the 8.5% CPI figure overstates the rise in the cost of living for richer households and understates it for poorer ones.
There are other reasons too. The CPI does not include mortgage interest payments, so homeowners whose mortgage payments rise may find their cost of living rising faster than the CPI. The basket is only updated once a year, so it may miss changes in what households buy.
Explanation
The key idea is that the CPI is an average: it uses average spending weights, so it cannot match every household's spending pattern. A Level 3 answer uses the figure to show that the categories with the biggest price rises (energy and food) take a much larger share of poorer households' spending, so their personal inflation rate is higher than 8.5%. Working out the weighted rates (10.0% and 7.0%) is a strong use of the data but is not required.