
Level:
Correct: 0
Incorrect: 0
Marks: 0/0
Exam Practice
Course:
Topics:
OCR GCSE Biology (Paper 4) Smart practice A mixed round aimed at your weak spots
Avg
score:
–
Topics
done:
0/29

Variation and classification

Practise 15 exam-style questions on Variation and classification for OCR GCSE Biology (Paper 4). Write your answer as you would in the exam and get it marked in seconds against the mark scheme, point by point, with the Study Helper on hand if you get stuck.

  • 15 questions
  • 1–6 marks each
  • Instant marking
  • No sign-up needed
15 questions, marked as you go

Sample questions with model answers

Here are 4 of the questions in this topic, each with a model answer, an explanation of why it earns the marks and the mark scheme an examiner would use.

Question 1

1 mark

Scientists compared the same section of a gene in two species of beetle, P and Q. The letters show the order of the bases in this section of DNA.

Species P: A T G C C T A G G A T C A A G T C C G A
Species Q: A T G C T T A G C A T C A A G T C A G A

What percentage of the bases in this section are different between species P and Q?

Choose your answer.

  • A 3%
  • B 15%
  • C 30%
  • D 85%

Model answer

B

Explanation

Count the positions where the two sequences differ (3), then divide by the total number of bases compared (20) and multiply by 100: 15%. Read the sequences position by position. A common slip is to give the percentage that is the same (85%) instead of the percentage that is different.

Mark scheme
  1. 1 mark

    B / 15%

    The only correct answer is B: the sections are 20 bases long and 3 bases are different (the 5th, 9th and 18th), so 3 ÷ 20 × 100 = 15%. A is not correct because it gives the number of different bases (3) as a percentage; C is not correct because it divides by 10 instead of by 20; D is not correct because 85% is the percentage of bases that are the same. ALLOW the letter or the value. If more than one option is given, do not award the mark.
Question 2

2 marks

Euglena is a single-celled organism that lives in ponds. Its cell contains chloroplasts but has no cell wall. It swims using a long flagellum, and in the dark it can take in food from its surroundings.

In the 1700s, Linnaeus classified all living organisms into two kingdoms: plants and animals.

Explain why Euglena is difficult to classify using this system.

Model answer

Euglena has chloroplasts, so it can photosynthesise like a plant. But it has no cell wall, it can swim, and it can take in food in the dark, which are features of animals. Because it has features of both plants and animals, it does not fit into either kingdom of a two-kingdom system.

Explanation

Plant cells have chloroplasts and a cellulose cell wall; animal cells have neither. Euglena mixes the features of both, so a system with only two kingdoms cannot place it. Organisms like this were one reason why later classification systems added more kingdoms.

Mark scheme
  1. 1 mark

    it has chloroplasts / chlorophyll / can photosynthesise, which is a feature of plants

    Max 2. Max 1 if the answer gives features of only one kingdom (only plant features or only animal features).

  2. 1 mark

    it has no cell wall / can move (swim) / takes in food, which are features of animals, so it has features of both kingdoms

    ALLOW it does not fit into either kingdom because it has some plant features and some animal features.

Question 3

3 marks

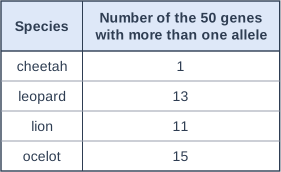
Scientists tested the same 50 genes in a population of each of four species of wild cat. For each species, they recorded how many of these genes had more than one allele in the population. The table shows the results. The data are simplified.

Most species have extensive genetic variation within a population. Use the data to explain why the cheetah is unusual.

Suggest why this could put cheetahs at risk if a new disease appears.

Table with columns "Species", "Number of the 50 genes with more than one allele". Species: cheetah; Number of the 50 genes with more than one allele: 1 | Species: leopard; Number of the 50 genes with more than one allele: 13 | Species: lion; Number of the 50 genes with more than one allele: 11 | Species: ocelot; Number of the 50 genes with more than one allele: 15.

Model answer

Only 1 of the 50 genes has more than one allele in the cheetah population, but 11 to 15 genes do in the other three cats. So cheetahs have very little genetic variation: they are genetically very similar to each other, which is unusual because most species have extensive genetic variation.

If a new disease appears, it is unlikely that any cheetahs have alleles that give resistance to it. If one cheetah is badly affected, nearly all of them are likely to be, so the whole population could die out.

Explanation

Compare the cheetah's value with the range for the other cats, quoting numbers. Genetic variation matters because, in a varied population, some individuals may have alleles that help them survive a new disease. A population of very similar individuals is likely to respond in the same way.

Mark scheme
  1. 1 mark

    only 1 of the 50 genes has more than one allele in cheetahs, compared with 11 to 15 genes in the other cats

    Max 2 if no data from the table are used. ALLOW 2% compared with 22% to 30%.

  2. 1 mark

    so cheetahs have very little genetic variation / are genetically very similar to each other / have almost the same alleles

    DO NOT ALLOW 'cheetahs have no genes'.

  3. 1 mark

    if one cheetah is affected / not resistant, most or all of them are likely to be, because none (or few) may have alleles that give resistance, so the whole population could die

    ALLOW there is less chance that some cheetahs have an allele that helps them survive the disease. IGNORE 'they will all get ill' with no reason.

Question 4

5 marks

Scientists can use differences in DNA to estimate how long ago two species shared a common ancestor.

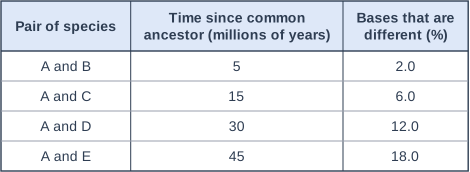
In one study, scientists compared the base sequence of the same gene in species A and in four other species. Fossils show how long ago each pair of species shared a common ancestor. The table shows the results. The data are simplified.

The percentage difference between species A and species F is 9.0%.

Use the data to estimate how long ago species A and species F shared a common ancestor.

Explain why the percentage difference increases with the time since the common ancestor.

Table with columns "Pair of species", "Time since common ancestor (millions of years)", "Bases that are different (%)". Pair of species: A and B; Time since common ancestor (millions of years): 5; Bases that are different (%): 2.0 | Pair of species: A and C; Time since common ancestor (millions of years): 15; Bases that are different (%): 6.0 | Pair of species: A and D; Time since common ancestor (millions of years): 30; Bases that are different (%): 12.0 | Pair of species: A and E; Time since common ancestor (millions of years): 45; Bases that are different (%): 18.0.

Model answer

From the table, the difference increases by 2.0% every 5 million years:
rate = 2.0 ÷ 5 = 0.4% per million years
time = 9.0 ÷ 0.4 = 22.5 million years
(This is also halfway between 6.0% at 15 million years and 12.0% at 30 million years.)

After two species separate, mutations happen in the DNA of each species and are passed on to their offspring. The changes in the two species are different, so the longer the two species have been separate, the more differences build up in the base sequence.

Explanation

The data show a constant rate: the difference is proportional to the time since the common ancestor (0.4% per million years), so divide 9.0 by 0.4. Multiplying instead of dividing gives 3.6, which is not sensible. This idea lets scientists use DNA sequencing to estimate when species shared a common ancestor, even without fossils.

Mark scheme
  1. 1 mark

    rate of change = 2.0 ÷ 5 = 0.4% per million years (or from any other pair); or a correct final answer of 22.5 million years (or any answer from 22 to 23 million years) with no working

    An answer of 22.5 million years (or any answer from 22 to 23 million years) with no working scores marking points 1, 2 and 3. ALLOW the difference is proportional to the time / doubles when the time doubles. ALLOW reading halfway between 6.0% (15 million years) and 12.0% (30 million years).

  2. 1 mark

    time = 9.0 ÷ 0.4 / 9.0 × 2.5 / 9.0 ÷ 2.0 × 5; or a correct final answer of 22.5 million years (or any answer from 22 to 23 million years) with no working

    ALLOW ECF from a wrong rate in marking point 1. DO NOT ALLOW 9.0 × 0.4 = 3.6.

  3. 1 mark

    22.5 (million years)

    ALLOW 22 to 23 million years. ALLOW 2.25 × 10⁷ years.

  4. 1 mark

    after the species separate, mutations happen (at random) in the DNA of each species and are passed on to the offspring

    ALLOW changes in the DNA sequence of each species are different / independent. ALLOW once the species are separate they do not interbreed, so the mutations in one species are not passed to the other. IGNORE 'the species evolve' unqualified.

  5. 1 mark

    the longer the species have been separate, the more mutations / differences have built up (at a fairly steady rate)

    ALLOW more time means more changes in the DNA sequence.

Ready to try the rest? Every answer you write is marked against the mark scheme, so you can see exactly where the marks are.

Study Helper Hints first, answers after you try

Stuck on this one? Ask for a hint and I’ll point you in the right direction, without giving the answer away. Once you’ve checked your answer, I’ll show you how the marks are awarded.