
Level:
Correct: 0
Incorrect: 0
Marks: 0/0
Exam Practice
Course:
Topics:
OCR GCSE Biology (Paper 4) Smart practice A mixed round aimed at your weak spots
Avg
score:
–
Topics
done:
0/29

Human interactions and biodiversity

Practise 21 exam-style questions on Human interactions and biodiversity for OCR GCSE Biology (Paper 4). Write your answer as you would in the exam and get it marked in seconds against the mark scheme, point by point, with the Study Helper on hand if you get stuck.

  • 21 questions
  • 1–6 marks each
  • Instant marking
  • No sign-up needed
20 questions, marked as you go

Sample questions with model answers

Here are 4 of the questions in this topic, each with a model answer, an explanation of why it earns the marks and the mark scheme an examiner would use.

Question 1

1 mark

A conservation scheme on a nature reserve aims to increase the population of a rare species of orchid.

Which data would show most clearly whether the scheme is increasing the orchid population?

Choose your answer.

  • A counts of the visitors to the reserve each year
  • B the area of the nature reserve
  • C the number of flowering orchid plants counted each year for ten years
  • D the total number of plant species recorded on the reserve in one year

Model answer

C

Explanation

Monitoring a conservation scheme means measuring the thing the scheme is meant to change, repeatedly, over a long enough time to see a trend. Plant populations go up and down from year to year, so one count, or data about something else, cannot show whether the scheme is working.

Mark scheme
  1. 1 mark

    C / the number of flowering orchid plants counted each year for ten years

    The only correct answer is C: counting the orchids themselves every year over a long period shows whether their population is changing. A is not correct because the number of visitors says nothing about the size of the orchid population; B is not correct because the area of the reserve does not change when the orchid population changes; D is not correct because one year of data cannot show a change, and the total number of species does not show the size of the orchid population. ALLOW the letter or the option. If more than one option is given, do not award the mark.
Question 2

2 marks

The UK Ivory Act 2018 came into force in 2022. It bans buying and selling almost all items that contain elephant ivory, however old they are. Before the Act, ivory items made before 1947 could be sold legally in the UK.

Explain how a ban that includes old ivory could help to protect elephants from poaching.

Model answer

It is very difficult to tell the age of a piece of ivory, so when old ivory could be sold legally, ivory from recently poached elephants could be passed off as old ivory. A ban on all ivory means any sale is illegal and easy to identify, so there is less demand for ivory and poaching elephants becomes less profitable, so fewer elephants are killed.

Explanation

A rule that allows some sales is hard to monitor, because illegal items can be hidden among the legal ones. A complete ban is easier to enforce and reduces the demand that drives poaching. Weak answers just say 'it stops people selling ivory' without linking it to the number of elephants killed.

Mark scheme
  1. 1 mark

    it is difficult to tell old ivory from new ivory, so (under the old rule) ivory from recently poached elephants could be sold as old, legal ivory

    ALLOW illegal ivory could be hidden among legal sales. ALLOW the age of ivory is hard to check / monitor.

  2. 1 mark

    a total ban means any sale of ivory is illegal, so there is less demand / it is less profitable to poach elephants for ivory, so fewer elephants are killed

    ALLOW it removes the market for ivory. ALLOW any sale can be identified as illegal, so it is easier to enforce.

Question 3

3 marks

Scientists studied the records of a butterfly species in Britain. The records are sent in by volunteers who see the butterfly and report where they saw it.

- Between 1980 and 2020, the northern edge of the area where the butterfly is recorded moved about 300 km further north.
- Over the same period, the mean concentration of carbon dioxide in the atmosphere rose from 339 ppm to 414 ppm (NOAA, Mauna Loa).
- The number of butterfly records sent in each year by volunteers increased about five times.

Explain how the rise in carbon dioxide could have caused this change in the distribution of the butterfly.

Suggest why these data do not prove that the rise in carbon dioxide caused the change.

Model answer

Carbon dioxide is a greenhouse gas, so the rise from 339 ppm to 414 ppm has helped to cause global warming. As Britain has become warmer, places further north have become warm enough for the butterfly and its caterpillars to survive and breed, so its range has spread north.

However, the number of records sent in each year increased about five times over the same period, so the butterfly may have been living further north before but simply not been recorded. Other changes, such as changes in habitats, could also explain the spread, so the correlation does not prove that carbon dioxide was the cause.

Explanation

Rising carbon dioxide affects distribution indirectly, through warming. Evidence from volunteer records must be treated with care: if many more people are looking, a species will seem to spread even if it has not moved. Always look for changes in recording effort and other variables before accepting a cause.

Mark scheme
  1. 1 mark

    carbon dioxide is a greenhouse gas, so more of it in the atmosphere causes global warming / higher temperatures

    Max 2 if only one part of the question is answered. Max 3. 1 mark for each point. ALLOW carbon dioxide traps heat / reduces the loss of heat from the Earth.

  2. 1 mark

    so areas further north become warm enough for the butterfly / its caterpillars / its food plants to survive and breed / temperature is no longer a limiting factor there

    ALLOW the butterfly can now complete its life cycle further north.

  3. 1 mark

    more records are sent in now, so the butterfly may have lived further north before but not been recorded / there are now more recorders in the north

    ALLOW the increase in recording effort could explain the change.

  4. 1 mark

    other factors could have caused the change, for example changes in habitat or land use, or more of its food plants; no temperature data are given to show that Britain became warmer; volunteers may have misidentified the butterfly; a correlation does not show cause

    IGNORE 'the data could be wrong' unqualified.

Question 4

4 marks

Carbon dioxide from the air dissolves in sea water and lowers its pH. Scientists predict that, if carbon dioxide emissions stay high, the mean pH of surface sea water will fall from about 8.1 now to about 7.8 by the year 2100 (IPCC, 2013).

Near some volcanic vents in the Mediterranean Sea, carbon dioxide bubbles out of the sea bed, so the nearby sea water has a lower pH. A scientist counted sea urchins on the rocks at four sites at different distances from a group of vents. Sea urchins have a skeleton made of calcium carbonate.

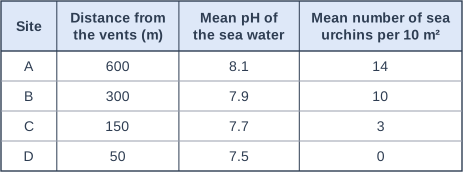
The table shows the results.

Evaluate how well these data support the prediction that rising carbon dioxide in the air will reduce the numbers of sea urchins in the Mediterranean Sea.

Table with columns "Site", "Distance from the vents (m)", "Mean pH of the sea water", "Mean number of sea urchins per 10 m²". Site: A; Distance from the vents (m): 600; Mean pH of the sea water: 8.1; Mean number of sea urchins per 10 m²: 14 | Site: B; Distance from the vents (m): 300; Mean pH of the sea water: 7.9; Mean number of sea urchins per 10 m²: 10 | Site: C; Distance from the vents (m): 150; Mean pH of the sea water: 7.7; Mean number of sea urchins per 10 m²: 3 | Site: D; Distance from the vents (m): 50; Mean pH of the sea water: 7.5; Mean number of sea urchins per 10 m²: 0.

Model answer

The data support the prediction. The lower the pH, the fewer sea urchins there were: 14 per 10 m² at pH 8.1, falling to 3 at pH 7.7 and none at pH 7.5. The predicted pH for 2100, 7.8, lies between sites B and C, which had only 10 and 3 urchins per 10 m². This makes sense, because in more acidic water it is harder for urchins to build and keep their calcium carbonate skeletons.

However, the vents may also change other things, such as the temperature of the water or the gases dissolved in it, so pH may not be the only cause. The data come from one group of vents, and urchins may simply have moved away from the vents into nearby water with a normal pH - when the whole sea changes, there will be nowhere to move to, but the change will also be slow, so urchins might adapt by natural selection. So the data give good support for the prediction, but they do not prove how urchin numbers will change across the whole sea.

Explanation

Natural carbon dioxide vents are used as a model of a future, more acidic ocean. A good evaluation quotes the trend, links the predicted pH to the sites, explains the effect of acidity on calcium carbonate skeletons and then questions how far a small local site can stand for a whole sea. Answers that only describe the table cannot reach full marks.

Mark scheme
  1. 1 mark

    (supports) the lower the pH, the fewer sea urchins there are: from 14 per 10 m² at pH 8.1 to none at pH 7.5

    Max 3 if the answer gives only one side (only evidence that supports the prediction or only limitations of the data). Max 4. Data must be quoted for this mark.

  2. 1 mark

    (supports) the predicted pH of 7.8 lies between sites B and C, where there were fewer urchins (10 and 3 per 10 m²) than at the normal pH of site A / the vents show what may happen at a pH similar to the predicted pH

    ALLOW sites B and C have a pH close to the predicted value and fewer urchins.

  3. 1 mark

    (explanation) in more acidic water / at a lower pH it is harder for urchins to build their calcium carbonate skeleton / their skeletons dissolve, so fewer survive

    ALLOW calcium carbonate reacts with acid.

  4. 1 mark

    (supports) the vents are a natural situation in the sea, where urchins have been exposed to a low pH for a long time, so the data show the effect on wild populations rather than in a short laboratory test

    ALLOW the data come from a real ecosystem / from the field rather than a laboratory.

  5. 2 marks

    limitations, for example: the vents may change other factors as well as pH, such as temperature or other gases, so these could cause the difference; there is only one group of vents / one area; the counts show only where urchins live, and urchins may simply move away from the vents to nearby water with a normal pH, which will not be possible when the whole sea changes; the change near the vents is local and sudden, but the change in the sea will be slow, so urchin populations might adapt by natural selection; the pH near the vents varies a lot from day to day, so the mean may hide very low values; the counts were made only once

    1 mark for each different limitation, max 2. ALLOW suggestions that answer a limitation, for example 'study vents in other seas' or 'measure temperature at each site'. IGNORE 'the scientist should repeat the counts' unqualified.

Ready to try the rest? Every answer you write is marked against the mark scheme, so you can see exactly where the marks are.

Study Helper Hints first, answers after you try

Stuck on this one? Ask for a hint and I’ll point you in the right direction, without giving the answer away. Once you’ve checked your answer, I’ll show you how the marks are awarded.