
Level:
Correct: 0
Incorrect: 0
Marks: 0/0
Exam Practice
Course:
Topics:
OCR GCSE Biology (Paper 4) Smart practice A mixed round aimed at your weak spots
Avg
score:
–
Topics
done:
0/29

Trophic levels, pyramids of biomass and biomass transfer

Practise 16 exam-style questions on Trophic levels, pyramids of biomass and biomass transfer for OCR GCSE Biology (Paper 4). Write your answer as you would in the exam and get it marked in seconds against the mark scheme, point by point, with the Study Helper on hand if you get stuck.

  • 16 questions
  • 1–6 marks each
  • Instant marking
  • No sign-up needed
16 questions, marked as you go

Sample questions with model answers

Here are 4 of the questions in this topic, each with a model answer, an explanation of why it earns the marks and the mark scheme an examiner would use.

Question 1

1 mark

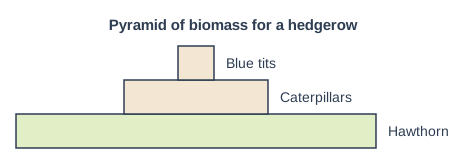
The diagram shows a pyramid of biomass for a hedgerow.

What does the width of each bar in a pyramid of biomass represent?

Choose your answer.

  • A the total dry mass of all the organisms at that trophic level in each square metre
  • B the energy released in respiration by each organism at that trophic level
  • C the mass of one organism at that trophic level
  • D the number of organisms at that trophic level in each square metre
Pyramid of biomass for a hedgerow. Pyramid diagram of 3 horizontal bars stacked on top of each other and centred, each labelled at its right-hand end. From the bottom up: "Hawthorn" (the bottom bar); "Caterpillars" (narrower than the bar below); "Blue tits" (much narrower than the bar below).

Model answer

A

Explanation

In a pyramid of biomass, each bar stands for one trophic level and its width shows the total biomass (normally dry mass) of every organism at that level in a given area, such as 1 m². This is why a single large hawthorn bush and many small caterpillars can be compared fairly. A pyramid of numbers (option D) can be an odd shape because it ignores the size of the organisms.

Mark scheme
  1. 1 mark

    A / the total dry mass of all the organisms at that trophic level in each square metre

    The only correct answer is A: a pyramid of biomass shows the total mass of living material (usually dry mass) of all the organisms at each trophic level in a given area, so the width of each bar is proportional to that total. B is not correct because a pyramid of biomass shows mass, not the energy released in respiration; C is not correct because the bar shows the mass of all the organisms at that level, not of one organism; D is not correct because that is a pyramid of numbers. ALLOW the letter or the option. If more than one option is given, do not award the mark.
Question 2

2 marks

Scientists measured the biomass at two trophic levels on a salt marsh in Essex:

• producers (plants such as cord-grass): 2.5 kg per m²
• primary consumers (plant-eating snails, insects and other animals): 140 g per m².

Calculate the efficiency of biomass transfer from the producers to the primary consumers.

Give your answer as a percentage.

Model answer

2.5 kg = 2500 g
Efficiency = 140 ÷ 2500 × 100 = 5.6%

Explanation

Efficiency of transfer = biomass at the higher level ÷ biomass at the lower level × 100, with both values in the same unit. The trap here is the units: 2.5 kg must be changed to 2500 g (or 140 g to 0.14 kg) before dividing. Dividing 140 by 2.5 gives a value that is 1000 times too large.

Mark scheme
  1. 1 mark

    140 ÷ 2500 × 100 / 0.14 ÷ 2.5 × 100; or a correct final answer of 5.6% with no working

    An answer of 5.6% with no working scores 2 marks. ALLOW 1 mark for 0.056 (the correct fraction, not converted to a percentage). ALLOW 1 mark for 5600% (the correct method with 2.5 kg not converted to grams, a power-of-ten error). 56% scores 0.

  2. 1 mark

    5.6 (%)

    IGNORE units.

Question 3

3 marks

In an area of tropical rainforest, the producers make 2000 g of new biomass per m² each year. Ecologists estimate that a population of animals can only survive at a trophic level if at least 0.1 g of new biomass per m² is produced at that level each year.

Calculate the number of trophic levels this rainforest could support if the efficiency of every biomass transfer is 5%.

Calculate the number of trophic levels it could support if the efficiency of every transfer were 10%.

Model answer

At 5%: 2000 → 100 → 5 → 0.25 → 0.0125 g per m² per year
The fourth level gets 0.25 g (at least 0.1 g) but a fifth would get only 0.0125 g, so the rainforest supports 4 trophic levels.
At 10%: 2000 → 200 → 20 → 2 → 0.2 → 0.02 g per m² per year
The fifth level gets 0.2 g but a sixth would get only 0.02 g, so it could support 5 trophic levels.

Explanation

Multiply by the efficiency at each transfer and stop when the biomass falls below the minimum needed: the number of levels includes the producers. A higher efficiency means more biomass reaches each level, so the chain can be longer. This is why food chains rarely have more than four or five trophic levels: biomass is lost at every transfer.

Mark scheme
  1. 1 mark

    at 5%: 2000 → 100 → 5 → 0.25 → 0.0125 (g per m² per year), each level being 5% of the one below; or a correct final answer of 4 trophic levels at 5% with no working

    An answer of 4 trophic levels (at 5%) and 5 trophic levels (at 10%) with no working scores 3 marks. ALLOW the working shown as 2000 × 0.05 = 100, 100 × 0.05 = 5, and so on. 3 and 4 (the transfers counted instead of the levels) score marking point 1 only, and only when the working is shown.

  2. 1 mark

    4 trophic levels at 5% (the fifth level would have only 0.0125 g, less than 0.1 g); or a correct final answer of 4 trophic levels at 5% with no working

    ALLOW 4 with the producers counted as the first level.

  3. 1 mark

    at 10%: 2000 → 200 → 20 → 2 → 0.2 (→ 0.02), so 5 trophic levels

    The working or the 0.2 for the fifth level must be seen for this mark unless the answer is given with no working (see marking point 1). ALLOW ECF for one arithmetic slip in the 10% chain if the number of levels follows from it.

Question 4

5 marks

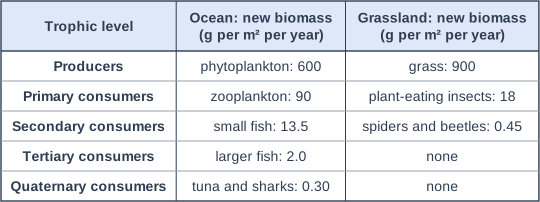
The table shows ecologists' estimates of the new biomass produced each year at each trophic level in a food chain in the ocean and in a food chain in a grassland.

• Phytoplankton are single cells. Zooplankton eat most of the phytoplankton that grows and digest most of what they eat.
• Grasshoppers and other plant-eating insects eat only a small part of the grass that grows. Grass contains a lot of cellulose, which the insects digest poorly, so much of the grass they eat passes out in their faeces.

Calculate the efficiency of biomass transfer from the producers to the primary consumers in each food chain.

Use the data and the information to explain why the ocean food chain has more trophic levels than the grassland food chain.

Table with columns "Trophic level", "Ocean: new biomass (g per m² per year)", "Grassland: new biomass (g per m² per year)". Trophic level: Producers; Ocean: new biomass (g per m² per year): phytoplankton: 600; Grassland: new biomass (g per m² per year): grass: 900 | Trophic level: Primary consumers; Ocean: new biomass (g per m² per year): zooplankton: 90; Grassland: new biomass (g per m² per year): plant-eating insects: 18 | Trophic level: Secondary consumers; Ocean: new biomass (g per m² per year): small fish: 13.5; Grassland: new biomass (g per m² per year): spiders and beetles: 0.45 | Trophic level: Tertiary consumers; Ocean: new biomass (g per m² per year): larger fish: 2.0; Grassland: new biomass (g per m² per year): none | Trophic level: Quaternary consumers; Ocean: new biomass (g per m² per year): tuna and sharks: 0.30; Grassland: new biomass (g per m² per year): none.

Model answer

Ocean: 90 ÷ 600 × 100 = 15%
Grassland: 18 ÷ 900 × 100 = 2%
In the ocean the zooplankton eat most of the phytoplankton and digest most of what they eat, so less biomass is left uneaten or egested. In the grassland the insects eat only a small part of the grass, and much of what they do eat is egested because the cellulose is digested poorly. So a much larger percentage of the biomass is passed on at each transfer in the ocean. Each level needs enough biomass to support a population: after two transfers the grassland has only 0.45 g per m² left, too little to support a fourth level, while the ocean still has 2.0 g per m² at its fourth level and can support a fifth.

Explanation

Efficiency = biomass at the higher level ÷ biomass at the lower level × 100. The number of trophic levels depends on how much biomass survives each transfer: biomass that is not eaten, is egested or is respired does not reach the next level. Because the ocean transfers are far more efficient, enough biomass reaches the top to support more levels.

Mark scheme
  1. 1 mark

    ocean: 90 ÷ 600 × 100 = 15 (%); or a correct final answer of 15% with no working

    An answer of 15% (ocean) and 2% (grassland) with no working scores marking points 1 and 2. Marking points 3 to 6: max 3.

  2. 1 mark

    grassland: 18 ÷ 900 × 100 = 2 (%)

    ALLOW 2.0. IGNORE units.

  3. 1 mark

    in the grassland most of the grass is not eaten (it dies and passes to decomposers), but in the ocean most of the phytoplankton is eaten, so more of the producers' biomass reaches the primary consumers

    ALLOW ORA (allow the reverse argument).

  4. 1 mark

    the cellulose in grass is digested poorly, so much of the biomass the insects eat is egested in faeces, but most of the phytoplankton eaten is digested, so less is egested

    ALLOW insects cannot digest / break down much of the cellulose, so it is lost in egestion.

  5. 1 mark

    so a larger percentage of the biomass is passed on at each transfer in the ocean / the transfers in the ocean are more efficient

    ALLOW a comparison using the efficiencies of later transfers, for example the ocean transfers are all about 15% but the grassland transfers are only about 2 to 2.5%.

  6. 1 mark

    each trophic level needs enough biomass to support a population: in the grassland too little biomass is left after two transfers to support a fourth level, but in the ocean enough is still left to support further levels

    ALLOW the biomass of the grassland secondary consumers is too small to feed another level. ALLOW the ocean still has more biomass at its fourth level than the grassland has at its third.

Ready to try the rest? Every answer you write is marked against the mark scheme, so you can see exactly where the marks are.

Study Helper Hints first, answers after you try

Stuck on this one? Ask for a hint and I’ll point you in the right direction, without giving the answer away. Once you’ve checked your answer, I’ll show you how the marks are awarded.