
Level:
Correct: 0
Incorrect: 0
Marks: 0/0
Exam Practice
Course:
Topics:
OCR GCSE Biology (Paper 1) Smart practice A mixed round aimed at your weak spots
Avg
score:
–
Topics
done:
0/29

Practical skills (biology PAGs B1-B8)

Practise 23 exam-style questions on Practical skills (biology PAGs B1-B8) for OCR GCSE Biology (Paper 1). Write your answer as you would in the exam and get it marked in seconds against the mark scheme, point by point, with the Study Helper on hand if you get stuck.

  • 23 questions
  • 1–6 marks each
  • Instant marking
  • No sign-up needed
20 questions, marked as you go

Sample questions with model answers

Here are 4 of the questions in this topic, each with a model answer, an explanation of why it earns the marks and the mark scheme an examiner would use.

Question 1

1 mark

A student uses a ruler marked in millimetres to measure the root of a germinating broad bean. The end of the root is between the 2.4 cm and 2.5 cm marks, but much closer to 2.4 cm.

Which length should the student record?

Choose your answer.

  • A 2 cm
  • B 2.4 cm
  • C 2.43 cm
  • D 2.5 cm

Model answer

B

Explanation

Record a measurement to the resolution of the instrument: a millimetre ruler measures to the nearest 0.1 cm, so the length is 2.4 cm. Writing 2.43 cm suggests a precision the ruler cannot give, and 2 cm throws away information.

Mark scheme
  1. 1 mark

    B / 2.4 cm

    The only correct answer is B: the ruler can measure to the nearest millimetre (0.1 cm), and the root is closer to the 2.4 cm mark. A is not correct because it ignores the millimetre marks and is less precise than the ruler allows; C is not correct because it claims a precision (0.01 cm) that a millimetre ruler cannot give; D is not correct because the end of the root is closer to 2.4 cm than to 2.5 cm. ALLOW the letter or the value. If more than one option is given, do not award the mark.

Question 2

2 marks

A student wants to find the mean reaction time of the 180 students in Year 10 at her school. She tests 5 of her friends with a ruler-drop test.

Explain why her sample may not represent Year 10, and suggest how she could choose a better sample.

Model answer

Five students is a very small sample, and her friends were not chosen at random, so they may be similar to each other and not typical of Year 10. She should test a larger sample, such as 30 students, chosen at random from the Year 10 list using a random number generator.

Explanation

A sample is representative when it is large enough and chosen at random, so that every student has the same chance of being picked. A few friends are likely to be similar to each other, which could make the mean reaction time too high or too low for the whole year group.

Mark scheme
  1. 1 mark

    5 students is a very small sample (of the 180)

    1 mark for any one of points 1 and 2, max 1. IGNORE it is not a fair test.

  2. 1 mark

    her friends were not chosen at random / her friends may be similar to each other, so they may not be typical of Year 10

    ALLOW her friends may all do the same activities, for example all play sport or video games.

  3. 1 mark

    test a larger number of students (for example 20 or more)

    1 mark for any one of points 3 and 4, max 1. ALLOW test every student in Year 10. IGNORE repeat the test (unqualified).

  4. 1 mark

    choose the students at random from the whole of Year 10 (for example names drawn from a hat / a random number generator and the year list)

    ALLOW give every student in Year 10 the same chance of being chosen.

Question 3

2 marks

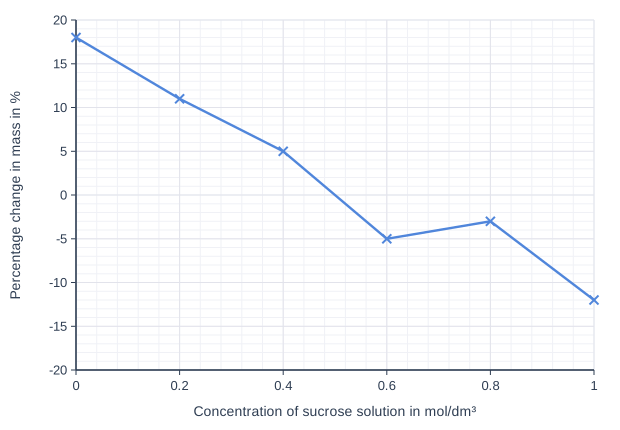
A student put cylinders of apple into sucrose solutions of six different concentrations. After 24 hours she calculated the percentage change in mass of each cylinder.

The graph shows her results. She joined each point to the next one with a straight line.

Her teacher said that a line of best fit would be better than joining the points.

Explain why a line of best fit is better for these results.

Line graph of percentage change in mass in % (y-axis, -20 to 20) against concentration of sucrose solution in mol/dm³ (x-axis, 0 to 1). The line joins the points (0, 18), (0.2, 11), (0.4, 5), (0.6, -5), (0.8, -3), (1, -12).

Model answer

Every result has some random error, so the points do not lie exactly on the pattern. For example, the point at 0.8 mol/dm³ is higher than the point at 0.6 mol/dm³, so joining the points makes the graph change direction where there is no real change. A line of best fit shows the overall trend, that the percentage change in mass falls as the concentration increases, and because it is based on all the results it gives more reliable estimates between the points, such as the concentration that gives no change in mass.

Explanation

Joining the points dot to dot treats every result as exact, so any random error shows up as a kink in the line. A line of best fit, drawn with about the same number of points on each side, shows the real pattern and gives more reliable readings between the points.

Mark scheme
  1. 1 mark

    each result has some (random) error / the points do not all fit the pattern exactly (for example the point at 0.8 mol/dm³ is higher than the point at 0.6 mol/dm³), so joining point to point shows changes in direction that are not real

    1 mark for each of any two of points 1 to 3, max 2. ALLOW the rise between 0.6 and 0.8 mol/dm³ is probably caused by an error, not by osmosis. ALLOW a line of best fit averages out the errors in the individual results. IGNORE it looks neater / tidier.

  2. 1 mark

    a line of best fit shows the overall trend / pattern (the percentage change in mass falls as the concentration increases)

    ALLOW it shows the relationship between concentration and percentage change in mass more clearly. IGNORE it is easier to read (unqualified).

  3. 1 mark

    a line of best fit gives more reliable estimates of values between the points (such as the concentration that causes no change in mass), because it is based on all the results

    ALLOW it gives a more reliable prediction of the percentage change in mass at a concentration that was not tested. IGNORE it can be used to read values from the graph (unqualified: values can also be read from a line that joins the points).

Question 4

3 marks

A student investigated osmosis in potato. She cut a potato chip that was exactly 50 mm long and left it in a concentrated sucrose solution for 8 hours. She then laid the chip along a ruler, as shown in the diagram. Arrow P points to one end of the chip and arrow Q points to the other end.

Use the equation: mean rate of change in length = change in length ÷ time

Calculate the mean rate of change in length of the chip, in mm per hour.

A ruler from 0 to 80 mm, divided into 8 equal parts by long marks, each split into 10 small divisions by short marks. Every long mark is numbered (0, 10, 20, 30, 40, 50, 60, 70 and 80). An arrow labelled P points to a mark on the scale. An arrow labelled Q points to a mark on the scale.

Model answer

Length after 8 hours = 61 − 15 = 46 mm
Change in length = 50 − 46 = 4 mm (the chip got shorter)
Mean rate of change in length = 4 ÷ 8 = 0.5 mm per hour

Explanation

The chip does not start at the zero mark, so its length is the difference between the readings at Q and P (61 − 15 = 46 mm), not the reading at Q. The chip got 4 mm shorter in 8 hours, so the mean rate is 4 ÷ 8 = 0.5 mm per hour. It got shorter because water moved out of its cells by osmosis into the more concentrated sucrose solution.

Mark scheme
  1. 1 mark

    length after 8 hours = 61 − 15 = 46 (mm); or a correct final answer of 0.5 mm per hour with no working

    An answer of 0.5 mm per hour with no working scores 3 marks. IGNORE the sign: an answer of −0.5 mm per hour also scores 3 marks. An answer of 1.375, 1.38 or 1.4 mm per hour ((61 − 50) ÷ 8, the reading at Q used as the length) scores marking points 2 and 3 by ECF. An answer of 5.75 mm per hour (46 ÷ 8, the length divided by the time) scores marking point 1 only.

  2. 1 mark

    change in length = 50 − 46 = 4 (mm) and 4 ÷ 8; or a correct final answer of 0.5 mm per hour with no working

    ALLOW 46 − 50 = −4 (mm) and −4 ÷ 8. ALLOW ECF from a wrong length after 8 hours.

  3. 1 mark

    0.5 (mm per hour)

    IGNORE the sign. ALLOW 0.50. ALLOW ECF from a wrong change in length correctly divided by 8. IGNORE units (the question gives them).

Ready to try the rest? Every answer you write is marked against the mark scheme, so you can see exactly where the marks are.

Study Helper Hints first, answers after you try

Stuck on this one? Ask for a hint and I’ll point you in the right direction, without giving the answer away. Once you’ve checked your answer, I’ll show you how the marks are awarded.