Practise 12 exam-style questions on Distance-time and velocity-time graphs for OCR GCSE Combined Science (Physics Paper 5). Write your answer as you would in the exam and get it marked in seconds against the mark scheme, point by point, with the Study Helper on hand if you get stuck.
12 questions
1–4 marks each
Instant marking
No sign-up needed
12 questions, marked as you go
Sample questions with model answers
Here are 4 of the questions in this topic, each with a model answer, an explanation of why it earns the marks and the mark scheme an examiner would use.
Question 1
1 mark
Which motion is shown by a straight line sloping downwards on a velocity-time graph?
Choose your answer.
A a car parked at the side of a road
B a lift going up at a steady speed
C a sprinter speeding up after the start
D a train braking steadily to a stop
Model answer
D (a train braking steadily to a stop)
Explanation
On a velocity-time graph the gradient shows the acceleration. A line sloping upwards means speeding up, a horizontal line means a steady velocity, and a straight line sloping downwards means slowing down at a steady rate. Be careful not to read it as a distance-time graph, where a horizontal line means the object is stationary.
Mark scheme
1 mark
D / a train braking steadily to a stop
The only correct answer is D: the train's velocity decreases by the same amount every second (a steady deceleration), so the line is straight and slopes downwards to zero. A is not correct because a parked car has zero velocity, shown by a horizontal line along the time axis; B is not correct because a steady speed gives a horizontal line above the time axis; C is not correct because a sprinter speeding up has an increasing velocity, so the line slopes upwards. ALLOW the letter or the option. If more than one option is given, do not award the mark.
Question 2
2 marks
A tortoise walks in a straight line across a lawn at a steady speed of 0.05 m/s for 60 s.
Describe the shape of: • the distance-time graph for this motion • the velocity-time graph for this motion.
Model answer
The distance-time graph is a straight line sloping upwards from the origin, because the distance increases by the same amount (0.05 m) every second. The velocity-time graph is a horizontal straight line at 0.05 m/s, because the velocity does not change.
Explanation
A steady speed means the distance goes up by the same amount every second, so the distance-time graph is a straight sloping line whose gradient is the speed. The velocity is the same all the time, so the velocity-time graph is flat. A common mix-up is to think a horizontal line always means 'stopped': that is only true on a distance-time graph.
Mark scheme
1 mark
distance-time graph: a straight line sloping upwards (from the origin)
ALLOW a straight diagonal line / a straight line with a constant (positive) gradient. DO NOT ALLOW a horizontal line or a curve for the distance-time graph.
1 mark
velocity-time graph: a horizontal (flat) straight line (at 0.05 m/s)
ALLOW a straight line parallel to the time axis / a line with zero gradient. DO NOT ALLOW a line sloping upwards, or a line along the time axis (at zero velocity).
Question 3
2 marks
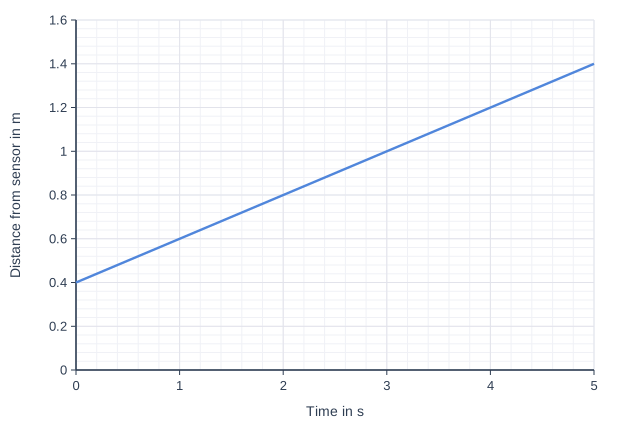
A motion sensor measures how far a trolley is from the sensor. The trolley moves away from the sensor in a straight line at a steady speed.
The graph shows the results.
Use the graph to calculate the speed of the trolley.
Model answer
In 5 s the distance from the sensor changes from 0.4 m to 1.4 m. Distance moved = 1.4 − 0.4 = 1.0 m speed = gradient = 1.0 ÷ 5 = 0.20 m/s
Explanation
The speed is the gradient of the line: the change in distance divided by the change in time. The line starts at 0.4 m, not at zero, so the trolley moved 1.4 − 0.4 = 1.0 m in 5 s, giving 0.20 m/s. Dividing 1.4 m by 5 s uses the distance from the sensor instead of the distance moved, which gives a speed that is too high.
Mark scheme
1 mark
change in distance and the matching time: 1.4 − 0.4 = 1.0 m in 5 s (or any matching pair, for example 0.2 m in 1 s); or a correct final answer of 0.2 m/s with no working
An answer of 0.2 m/s (0.20 m/s) with no working scores 2 marks. The line does not start at 0 m: the trolley was already 0.4 m from the sensor when the timing started. DO NOT ALLOW 1.4 ÷ 5 = 0.28 m/s (the distance from the sensor used instead of the distance moved): 0.28 m/s scores 0.
1 mark
evaluation: 0.2 (m/s) / 0.20 (m/s)
For example 1.0 ÷ 5. IGNORE units, as the question does not ask for them.
Question 4
3 marks
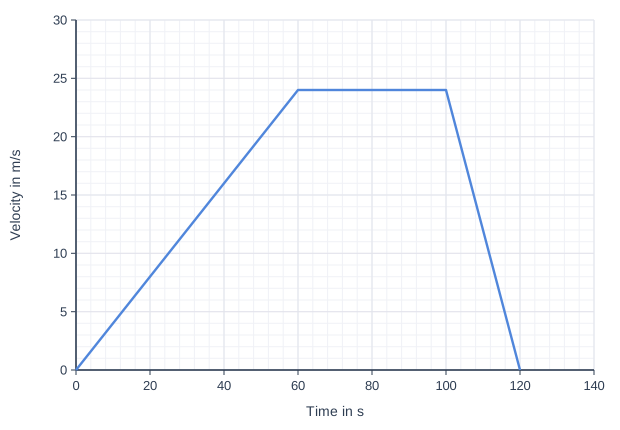
The graph shows the velocity of an underground train as it travels between two stations.
Use values from the graph to show that the deceleration of the train is greater than its acceleration.
Model answer
Acceleration from 0 to 60 s = change in velocity ÷ time = 24 ÷ 60 = 0.4 m/s² Deceleration from 100 to 120 s = 24 ÷ 20 = 1.2 m/s² 1.2 m/s² is greater than 0.4 m/s², so the deceleration is greater (it is three times the acceleration).
Explanation
The acceleration is the gradient of a velocity-time graph. The train gains 24 m/s in 60 s but loses 24 m/s in only 20 s, so the line is steeper when it slows down. Working out both values (0.4 m/s² and 1.2 m/s²) and comparing them shows the deceleration is three times as big.
Mark scheme
1 mark
acceleration (0 to 60 s) = 24 ÷ 60 = 0.4 (m/s²)
This is a 'show that' question: the statement in the question on its own scores 0, and the marks are for values from the graph. ALLOW 0.40 m/s². ALLOW for points 1 and 2 together: the velocity changes by 24 m/s in both parts, but it takes only 20 s to slow down compared with 60 s to speed up (both times and the change in velocity quoted).
comparison: 1.2 m/s² is greater than 0.4 m/s² / the deceleration is three times the acceleration
The comparison must use values found from the graph (points 1 and 2, or the times in the alternative route). ALLOW ECF: a correct comparison of wrong values. ALLOW the line is steeper when the train slows down, when supported by values.
Ready to try the rest? Every answer you write is marked against the mark scheme, so you can see exactly where the marks are.
Ctrl + Enter to check
Study HelperHints first, answers after you try
Stuck on this one? Ask for a hint and I’ll point you in the right direction, without giving the answer away. Once you’ve checked your answer, I’ll show you how the marks are awarded.