Practise 24 exam-style questions on Use of data: the body, fitness and training for AQA GCSE Physical Education (Paper 1). Write your answer as you would in the exam and get it marked in seconds against the mark scheme, point by point, with the Study Helper on hand if you get stuck.
24 questions
1–9 marks each
Instant marking
No sign-up needed
20 questions, marked as you go
Sample questions with model answers
Here are 4 of the questions in this topic, each with a model answer, an explanation of why it earns the marks and the mark scheme an examiner would use.
Question 1
1 mark
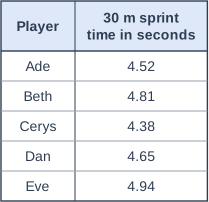
The table shows the results of five hockey players in the 30 Metre Sprint Test.
Which player was the fastest?
Choose your answer.
Ade
Cerys
Dan
Eve
Model answer
Cerys
Explanation
In a sprint test the fastest performer has the lowest time. Cerys ran 30 m in 4.38 seconds, the lowest time in the table. Eve has the highest number (4.94 seconds), so she was the slowest - choosing the biggest number is the common mistake when reading timed results.
Mark scheme
1 mark
Cerys
If more than one option is given, 0 marks.
Question 2
2 marks
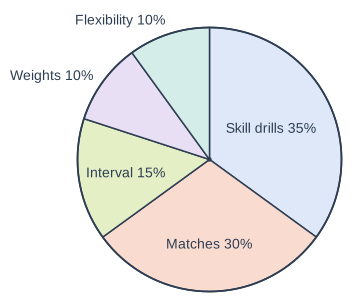
The pie chart shows how Callum, a footballer, divides his training time in a typical week. He trains for 8 hours each week.
Calculate how many minutes Callum spends on interval training each week. Show your working.
Model answer
8 hours = 8 × 60 = 480 minutes. Interval training is 15% of the week: 480 × 0.15 = 72 minutes.
Explanation
Convert the total to minutes first (8 × 60 = 480), then find the percentage: 15% of 480 = 72 minutes. A common error is to work out 15% of 8 and give the answer as 1.2 minutes - it is 1.2 hours.
Mark scheme
1 mark
8 hours = 480 minutes and 15% of 480 / 480 × 0.15 / 480 ÷ 100 × 15
Method: accept 15% of 8 hours = 1.2 hours.
1 mark
72 minutes
Accept 1.2 hours or 1 hour 12 minutes. Correct answer with no working scores 2 marks.
Question 3
3 marks
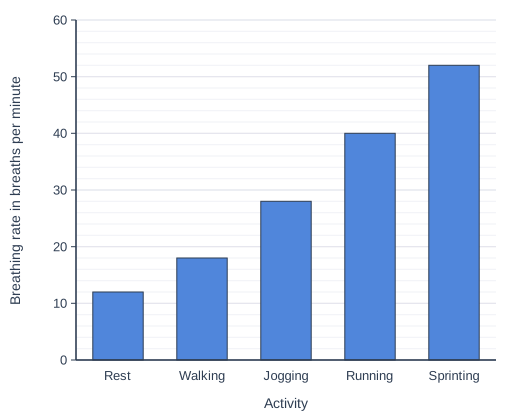
A student measured her breathing rate at rest and straight after four activities of increasing intensity. Her results are shown in the bar chart.
Describe the relationship between exercise intensity and breathing rate shown in the bar chart, and explain why breathing rate changes in this way.
Model answer
As the intensity of the activity increases, her breathing rate increases, from 12 breaths per minute at rest to 52 breaths per minute after sprinting. This is because her working muscles need more oxygen to release energy, and more carbon dioxide is produced, which must be breathed out.
Explanation
A relationship links the two variables: as one increases, so does the other. Breathing rate rises with intensity because more oxygen must be taken in and more carbon dioxide removed. A common weakness is to list the values for each bar without stating the overall relationship.
Mark scheme
1 mark
As intensity increases, breathing rate increases / the higher the intensity the higher the breathing rate, e.g. from 12 breaths per minute at rest to 52 when sprinting
Description: sub-max 1 mark. Data is not required but must be accurate if quoted.
1 mark
More oxygen is needed by the working muscles (for aerobic respiration/energy)
Explanation: sub-max 2 marks.
1 mark
More carbon dioxide is produced and must be removed
1 mark
At high intensity (sprinting) breathing stays high to help repay the oxygen debt / anaerobic work produces lactic acid
Max 3.
Question 4
4 marks
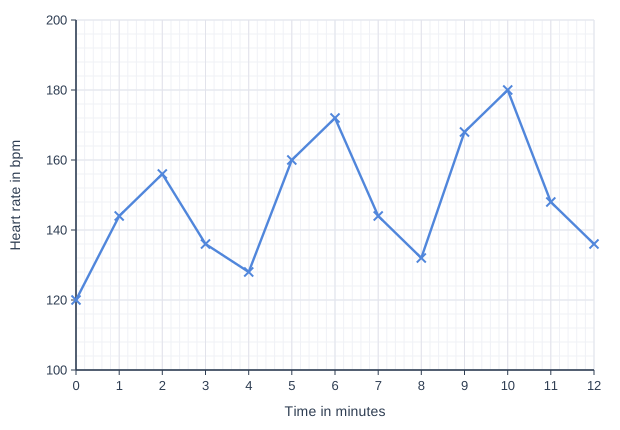
Zara is 16 years old. The graph shows her heart rate during an interval training session made up of three 2-minute work periods, each followed by 2 minutes of rest.
Calculate Zara's anaerobic training zone (80-90% of her maximum heart rate). Use the graph to state which of her work periods reached this zone.
Model answer
Maximum heart rate = 220 - 16 = 204 bpm. 80% of 204 = 0.8 × 204 = 163.2 bpm. 90% of 204 = 0.9 × 204 = 183.6 bpm. So her anaerobic training zone is 163.2-183.6 bpm. Work period 1 peaked at 156 bpm, which is below the zone. Work period 2 peaked at 172 bpm and work period 3 at 180 bpm, so these two reached the anaerobic zone.
Explanation
Maximum heart rate is 220 minus age; the anaerobic zone is 80-90% of it and the aerobic zone 60-80%. Then compare the peaks on the graph with the zone: the first work period only reached 156 bpm, so it was still in the aerobic zone. A common mistake is to subtract 80 and 90 from the maximum heart rate instead of finding percentages.
Mark scheme
1 mark
Maximum heart rate = 220 - 16 = 204 bpm
1 mark
80% = 163.2 bpm (0.8 × 204)
Accept 163 bpm. Allow follow-through from an incorrect maximum heart rate.
1 mark
90% = 183.6 bpm (0.9 × 204)
Accept 184 or 183 bpm. Allow follow-through from an incorrect maximum heart rate.
1 mark
Work periods 2 and 3 reached the zone (peaks of 172 and 180 bpm); work period 1 did not (peak of 156 bpm)
Allow follow-through from the zone calculated. Must identify both periods 2 and 3 and not period 1.
Ready to try the rest? Every answer you write is marked against the mark scheme, so you can see exactly where the marks are.
Ctrl + Enter to check
Study HelperHints first, answers after you try
Stuck on this one? Ask for a hint and I’ll point you in the right direction, without giving the answer away. Once you’ve checked your answer, I’ll show you how the marks are awarded.