Level:
Correct: 0
Incorrect: 0
Marks: 0/0
Exam Practice
Course:
Topics:
AQA GCSE Sociology (Paper 2) Smart practice A mixed round aimed at your weak spots
Unit 1
The sociological approach
Unit 2
Crime and deviance
Unit 3
Social stratification
Functionalist theory of stratification
Socio-economic class
Life chances
Life chances
Poverty as a social issue
Power and authority
Power and authority
Power relationships
Power relationships
Unit 4
Sociological research methods
Avg
score:
–
Topics
done:
0/14

Data, sources and research issues: crime and stratification

Practise 34 exam-style questions on Data, sources and research issues: crime and stratification for AQA GCSE Sociology (Paper 2). Write your answer as you would in the exam and get it marked in seconds against the mark scheme, point by point, with the Study Helper on hand if you get stuck.

  • 34 questions
  • 1–12 marks each
  • Instant marking
  • No sign-up needed
20 questions, marked as you go

Sample questions with model answers

Here are 4 of the questions in this topic, each with a model answer, an explanation of why it earns the marks and the mark scheme an examiner would use.

Question 1

1 mark

What term is commonly used by sociologists to describe the moral principles that researchers must take into account, such as avoiding harm to participants and respecting their privacy?

Choose your answer.

  • Bias
  • Ethical considerations
  • Reliability
  • Validity

Model answer

Ethical considerations

Explanation

Ethical considerations include informed consent, confidentiality and protection from harm, and they can rule out some methods, such as covert research with vulnerable groups. Reliability and validity are about the quality of data, not the treatment of participants.

Mark scheme
  1. 1 mark

    Ethical considerations

    If more than one option is given, 0 marks.

Question 2

2 marks

Item D
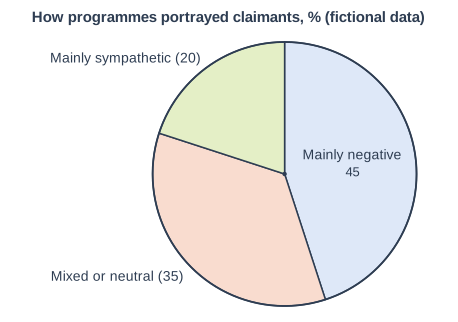
A sociologist carried out a content analysis of 80 television documentaries and reality programmes about people claiming welfare benefits, broadcast on national channels over five years (fictional study). Each programme was coded using a fixed list of categories, including how claimants were portrayed and whether benefit fraud was shown or mentioned. The pie chart in Item D shows the percentage of programmes that portrayed claimants in each way (fictional data). Benefit fraud was shown or mentioned in about a quarter of the programmes.

From Item D, examine one strength of the research.

How programmes portrayed claimants, % (fictional data). Pie chart. A circle divided into sectors, drawn clockwise from the top (12 o'clock): Mainly negative (45 printed in it), 162°; Mixed or neutral (35 printed in it), 126°; Mainly sympathetic (20 printed in it), 72°. (Angles are not printed on the chart; these are the drawn sizes, which can be measured with a protractor.)

Model answer

One strength is that every programme was coded using the same fixed list of categories. This is a strength because another researcher could repeat the coding on the same programmes and check the results, making the findings more reliable and allowing clear comparisons, such as the 45% of programmes coded as mainly negative.

Explanation

Both marks need a strength from Item D and a clear reason why it improves the research, such as reliability or representativeness. A common error is to describe what the programmes showed rather than a strength of the method.

Mark scheme
  1. 1 mark

    1 mark for an analysis of the item: a possible strength of the research identified from Item D, relating to its methods or findings, eg every programme was coded using a fixed list of categories / it analysed 80 programmes on national channels over five years / it used existing secondary sources. (AO3)

    Indicative content (AO3; not exhaustive, credit other valid points): Fixed coding categories applied to every programme make the analysis systematic, quantitative and repeatable (reliability); 80 programmes on national channels over five years is a large sample, so findings are more representative of television coverage; secondary sources are readily available, can be re-watched and are cheap; no contact with participants, so no problems of consent or harm for the researcher; produces clear figures (eg 45% mainly negative) that can be compared between channels or over time; reveals how the media may reinforce stereotypes such as the 'welfare scrounger'.

  2. 1 mark

    1 mark for evaluation: a reason why this is a strength, eg another researcher could apply the same categories to the same programmes to check the results, so the findings are more reliable / a large sample over five years gives a fuller picture than a few programmes, so findings are more representative of television coverage / programmes already exist and can be watched repeatedly, and the research involves no contact with the people shown, so it is cheap and raises few ethical problems for the researcher. (AO3)

    Only for a reason that explains why the point identified is a strength (a judgement or conclusion about it); restating the point is not enough.

Question 3

4 marks

Item B
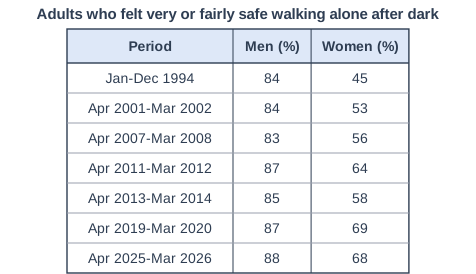
The Crime Survey for England and Wales asks adults how safe they feel walking alone in their area after dark. The table in Item B shows the percentage of men and of women who said they felt very or fairly safe, in selected years. ONS notes that changes to the questionnaire in 2012/13 mean that earlier figures may not be fully comparable with later ones, and that since then the question has been asked of only a quarter of the sample.
Source: ONS, Crime in England and Wales: Annual supplementary tables, year ending March 2026 (Table B7).

Describe the kind of data presented in Item B, state whether women's feelings of safety have increased or decreased over the period, and explain one factor that could account for this change.

Adults who felt very or fairly safe walking alone after dark. Table with columns "Period", "Men (%)", "Women (%)". Period: Jan-Dec 1994; Men (%): 84; Women (%): 45 | Period: Apr 2001-Mar 2002; Men (%): 84; Women (%): 53 | Period: Apr 2007-Mar 2008; Men (%): 83; Women (%): 56 | Period: Apr 2011-Mar 2012; Men (%): 87; Women (%): 64 | Period: Apr 2013-Mar 2014; Men (%): 85; Women (%): 58 | Period: Apr 2019-Mar 2020; Men (%): 87; Women (%): 69 | Period: Apr 2025-Mar 2026; Men (%): 88; Women (%): 68.

Model answer

The data in Item B are quantitative official statistics - secondary data from the Crime Survey for England and Wales, a large-scale victim survey, measuring people's feelings of safety. Women's feelings of safety have increased: the percentage who felt very or fairly safe walking alone after dark rose from 45% in 1994 to 68% in the year ending March 2026, a rise of 23 percentage points, although there was a dip after the questionnaire changed in 2012/13. One factor that may account for this is the long-term fall in crime. CSEW estimates of crime fell sharply from the mid-1990s, so fewer women would have experienced street crime or heard about it from friends and neighbours, making walking alone after dark seem less risky. However, women's figures remain about 20 points below men's, which feminists link to continuing fear of male violence.

Explanation

Full marks need all three parts: an accurate description of the data, the upward trend for women with figures, and a developed explanation of one factor. A common mistake is to describe the men's figures, which barely changed, instead of the women's.

Mark scheme
  1. 4 marks

    Levels of response (4 marks). AO1 = 1 mark, AO2 = 3 marks. 'Context' here refers to the trend in the percentage of women who felt safe walking alone after dark shown in Item B.
    Level 4 (4 marks): Relevant description of the data (AO1). Upward trend identified and an appropriate, detailed and well-developed explanation offered of sociological theories, concepts, evidence and methods with a good application to the context. (AO2)
    Level 3 (3 marks): Relevant description of the data (AO1). Upward trend identified with an explanation of sociological theories, concepts, evidence and methods containing some inaccuracies or omissions but which has some application to the context. (AO2)
    Level 2 (2 marks): Relevant description of the data (AO1). Upward trend identified with either no explanation or a largely inaccurate or irrelevant explanation of sociological theories, concepts, evidence and methods that is only weakly applied to the context. (AO2)
    Level 1 (1 mark): Relevant description of the data. (AO1)
    0 marks: Nothing worthy of credit.

    Indicative content AO1 (not exhaustive, credit other valid points): Quantitative data; official statistics from the ONS; secondary data; data from a large-scale victim survey (the CSEW) measuring feelings of safety (fear of crime). Accept any one accurate description. Indicative content AO2: Upward trend for women: from 45% in 1994 to 68% in the year ending March 2026, a rise of 23 percentage points, despite a dip between 2011/12 (64%) and 2013/14 (58%) around the questionnaire change; men stayed high at 83-88% throughout, so the gap narrowed from 39 to 20 points. Factors: falling crime (CSEW crime estimates fell substantially after the mid-1990s), so fewer people experience or hear about street crime; better street lighting, CCTV and mobile phones making people feel safer; changes in women's lives, eg more women in paid work and in public spaces at night, increasing confidence; campaigns and policing focused on violence against women and girls. Credit recognition that the figures measure feelings rather than actual risk, and that the remaining gap is linked by feminists to fear of male violence. NB: Do not credit 'a downward trend'. Credit an accurate reading of the figures, including the dip in 2013/14.

Question 4

4 marks

Identify and explain one advantage of using online questionnaires to research people's experiences of cybercrime.

Model answer

One advantage is that respondents can answer anonymously, which is important because many victims of cybercrime feel embarrassed. People who have been tricked by an online scam or had their accounts hacked may blame themselves and be reluctant to admit it face to face to an interviewer. An online questionnaire with no interviewer present, and no names collected, allows them to describe what happened privately, so they are more likely to answer honestly, improving the validity of the data. It also suits the topic because most people at risk of cybercrime use the internet, so the questionnaire reaches the relevant population, and a link can be sent to a large sample cheaply. Closed answers are recorded automatically, so patterns, such as which age groups are most often targeted, can be found quickly.

Explanation

The best answers select one advantage and link it to the particular features of cybercrime, such as embarrassment or the fact that victims are internet users. Generic advantages of questionnaires with no link to cybercrime are only weakly applied.

Mark scheme
  1. 4 marks

    Levels of response (4 marks). AO1 = 1 mark, AO2 = 3 marks. 'Context' here refers to the use of online questionnaires to research experiences of cybercrime.
    Level 4 (4 marks): Relevant advantage selected (AO1) and an appropriate, detailed and well-developed explanation of relevant sociological theories, concepts, evidence and methods offered with a good application to the context. (AO2)
    Level 3 (3 marks): Relevant advantage selected (AO1) with an explanation of relevant sociological theories, concepts, evidence and methods containing some inaccuracies or omissions but which has some application to the context. (AO2)
    Level 2 (2 marks): Relevant advantage selected (AO1) with a largely inaccurate or irrelevant explanation of relevant sociological theories, concepts, evidence and methods that is only weakly applied to the context. (AO2)
    Level 1 (1 mark): Relevant advantage selected. (AO1)
    0 marks: Nothing worthy of credit.

    Indicative content AO1 (not exhaustive, credit other valid points): They reach internet users, the population at risk of cybercrime; cheap and quick to send to a large sample; anonymity encourages honest answers about embarrassing experiences (eg being scammed); answers are easy to analyse (quantitative, recorded automatically); they can include people across the country; respondents can complete them at a convenient time. Credit other valid advantages. Indicative content AO2: Population eg most victims of cybercrime are internet users, so an online questionnaire reaches the relevant group; anonymity eg victims of online scams or hacking may feel embarrassed, so answering privately without an interviewer encourages honesty and improves validity; scale and cost eg a link can be sent to thousands of people at little cost, giving a large sample; analysis eg closed answers are recorded and counted automatically, so patterns (eg which age groups are most often targeted) can be identified quickly. Credit awareness that online samples may be self-selected, if used to qualify the advantage.

Ready to try the rest? Every answer you write is marked against the mark scheme, so you can see exactly where the marks are.

Study Helper Hints first, answers after you try

Stuck on this one? Ask for a hint and I’ll point you in the right direction, without giving the answer away. Once you’ve checked your answer, I’ll show you how the marks are awarded.