A sealed, rigid metal can contains air at 20 °C. A pressure sensor connected to a data logger measures the pressure of the air in the can.
At time 0, the can is put into a large beaker of water at 80 °C.
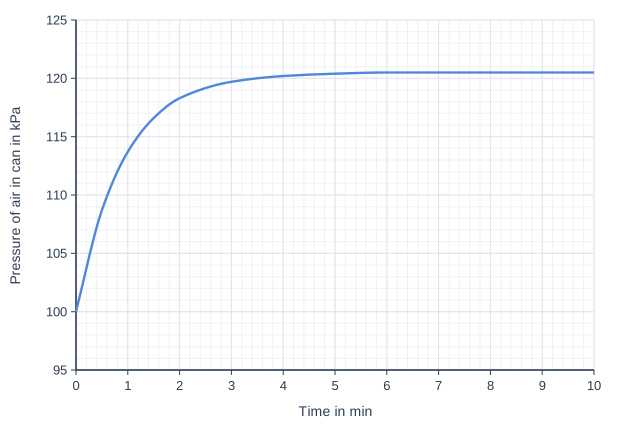
The graph shows the pressure of the air in the can for the next 10 minutes.
Explain the shape of the graph.
Model answer
When the can is put in the hot water, the air inside is heated and its temperature rises. The air particles gain kinetic energy and move faster, so they collide with the walls of the can more often and with more force, and the pressure increases. The pressure levels off at about 120 kPa when the air has reached the temperature of the water, 80 °C. The temperature then stays the same, so the average speed of the particles stays the same and the collisions with the walls do not change, so the pressure stays constant.
Explanation
The rise in pressure follows the rise in temperature of the air: faster particles hit the walls more often and harder. The curve levels off because energy stops being transferred once the air reaches the water's temperature, so the particles' average speed, and the pressure, then stay the same. Saying the particles stop moving when the graph is level is a common error.