Practise 23 exam-style questions on Use of data: participation, psychology and health for AQA GCSE Physical Education (Paper 2). Write your answer as you would in the exam and get it marked in seconds against the mark scheme, point by point, with the Study Helper on hand if you get stuck.
23 questions
1–9 marks each
Instant marking
No sign-up needed
20 questions, marked as you go
Sample questions with model answers
Here are 4 of the questions in this topic, each with a model answer, an explanation of why it earns the marks and the mark scheme an examiner would use.
Question 1
1 mark
A sports club wants to collect quantitative data from all 600 of its members as quickly as possible.
Which one of these methods should it use?
Choose your answer.
Interviews
Observations
Questionnaire
Group discussions
Model answer
Questionnaire
Explanation
Questionnaires and surveys collect quantitative data and can be completed by hundreds of people at once, so they suit a large club. Interviews, observations and group discussions produce qualitative data and take much longer for 600 people.
Mark scheme
1 mark
Questionnaire
If more than one option is given, 0 marks.
Question 2
3 marks
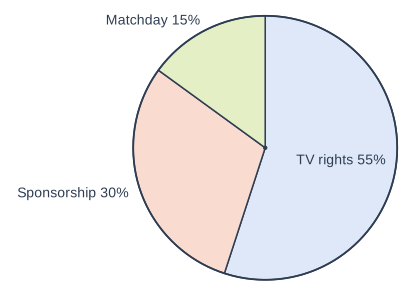
The pie chart shows where a professional football club's income came from in one season (invented data). The club's total income was £200 million.
Calculate the club's income from sponsorship, and explain one reason why sponsors are willing to pay the club so much.
Model answer
30% of £200 million = 0.3 × 200 = £60 million. Sponsors pay a lot because the club's matches are shown on TV to millions of people, so the sponsor's logo on the shirts is seen by a huge audience, which helps the company sell more of its products.
Explanation
Find the percentage of the total: 30% of £200 million is £60 million. Sponsors pay for exposure: the bigger the media audience, the more people see their brand. Note that most of this club's income comes from TV rights, showing how important the media is to professional sport.
Mark scheme
1 mark
30% of £200 million / 200 × 0.3
Method.
1 mark
£60 million
Correct answer with no working scores 2 marks.
1 mark
The club's matches are shown on TV/in the media to very large audiences, so the sponsor's brand is seen by millions of people, increasing its sales / improving its image (by linking it to a successful club)
Reason: 1 mark. Must explain the benefit to the sponsor.
Question 3
3 marks
Maya gave a questionnaire to 20 members of her netball club. All of them said they do more than 5 hours of exercise a week. Maya concluded that most teenagers in the UK do more than 5 hours of exercise a week.
Evaluate Maya's conclusion.
Model answer
Maya's conclusion is not valid. Her sample of 20 is far too small to represent all teenagers in the UK. It is also biased, because members of a netball club are already active and likely to exercise more than most teenagers. She would need a much larger, random sample from across the UK to reach this conclusion.
Explanation
When evaluating a conclusion, check the size of the sample, whether it is representative, and how the data was collected. Here the sample is small and biased towards active people, so the results cannot be generalised to all UK teenagers. A strong answer ends with a clear judgement.
Mark scheme
1 mark
The sample is too small (only 20 people) to represent all UK teenagers
One mark for each valid evaluative point, max 3.
1 mark
The sample is biased / not representative: members of a sports club are already active, so they are likely to exercise more than other teenagers
1 mark
All from one club / one sport / one area / possibly mainly one gender or age, so the results cannot be generalised
1 mark
Questionnaire answers are self-reported, so people may exaggerate or estimate inaccurately
1 mark
Judgement: the conclusion is not valid / she would need a larger, random sample of teenagers from across the UK
Max 3.
Question 4
4 marks
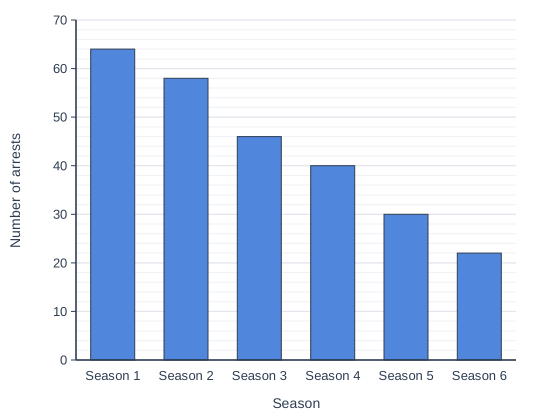
The bar chart shows the number of arrests at a football club's home matches over six seasons (invented data).
Describe the trend in arrests, and suggest two measures the club may have introduced that could explain this trend.
Model answer
The number of arrests fell every season, from 64 in Season 1 to 22 in Season 6. The club may have installed more CCTV cameras so troublemakers can be identified, and it may have stopped the sale of alcohol around the ground before kick-off.
Explanation
Describe the overall trend with data from the first and last seasons. Strategies used to combat hooliganism include CCTV, banning orders, alcohol restrictions, more police and stewards, segregation and all-seater stadia. Each suggestion should be a realistic measure a club could take.
Mark scheme
1 mark
Trend: the number of arrests decreases each season
Description: sub-max 2 marks.
1 mark
Data: from 64 in Season 1 to 22 in Season 6 (a fall of 42)
1 mark
Measure 1, e.g. more CCTV in and around the ground / banning orders for known troublemakers / alcohol restrictions (no alcohol in sight of the pitch, alcohol-free trains or coaches) / more police and stewards / segregation of rival fans / all-seater stadium / earlier kick-off times / education or family-friendly campaigns
Measures: one mark each, sub-max 2.
1 mark
Measure 2: a different measure from measure 1
Max 4.
Ready to try the rest? Every answer you write is marked against the mark scheme, so you can see exactly where the marks are.
Ctrl + Enter to check
Study HelperHints first, answers after you try
Stuck on this one? Ask for a hint and I’ll point you in the right direction, without giving the answer away. Once you’ve checked your answer, I’ll show you how the marks are awarded.