
Level:
Correct: 0
Incorrect: 0
Marks: 0/0
Exam Practice
Course:
Topics:
Avg
score:
–
Topics
done:
0/22

Practical skills (biology PAGs B1-B5)

Practise 16 exam-style questions on Practical skills (biology PAGs B1-B5) for OCR GCSE Combined Science (Biology Paper 8). Write your answer as you would in the exam and get it marked in seconds against the mark scheme, point by point, with the Study Helper on hand if you get stuck.

  • 16 questions
  • 1–6 marks each
  • Instant marking
  • No sign-up needed
16 questions, marked as you go

Sample questions with model answers

Here are 4 of the questions in this topic, each with a model answer, an explanation of why it earns the marks and the mark scheme an examiner would use.

Question 1

1 mark

A student notices that there are more barnacles on rocks near the low tide mark than on rocks higher up the shore. Barnacles are small animals that feed by filtering food from sea water.

Which is a hypothesis that the student could test?

Choose your answer.

  • A Barnacle numbers decrease with height up the shore, because higher rocks are covered by sea water for less time.
  • B Barnacles prefer rocks near the low tide mark, because they like to be as close to the sea as possible.
  • C How does the number of barnacles on the rocks change with height above the low tide mark?
  • D The seashore is an interesting habitat, so the student should count the barnacles on every rock.

Model answer

A

Explanation

A hypothesis is a testable idea, based on scientific knowledge, about how one variable affects another. A good hypothesis names the variables to measure and gives a scientific reason, so the results can support it or not. A question such as option C is a starting point for an investigation, but it makes no prediction.

Mark scheme
  1. 1 mark

    A / Barnacle numbers decrease with height up the shore, because higher rocks are covered by sea water for less time.

    The only correct answer is A: it predicts a relationship between two variables that can be measured (height up the shore and number of barnacles) and gives a reason based on scientific knowledge (barnacles can feed only when they are covered by sea water). B is not correct because 'they like to be close to the sea' is not a scientific explanation, so the reason cannot be tested; C is not correct because it is a question for an investigation, not a hypothesis: it makes no prediction and gives no explanation; D is not correct because it is an opinion about the habitat and a suggestion for the method, not a testable prediction. ALLOW the letter or the option. If more than one option is given, do not award the mark.
Question 2

2 marks

A student wants to find out whether oak trees in a park produce larger acorns than oak trees in a wood. Under one tree in each place, she picks up the 20 largest acorns she can find and measures their length.

Explain why her samples may not be representative, and describe a better way to choose the acorns.

Model answer

Picking the largest acorns is biased: the samples show only the biggest acorns, not the typical size, and she may judge 'largest' differently in each place. She should choose acorns at random, for example by collecting every acorn inside quadrats placed at random coordinates, under several trees in each place.

Explanation

A representative sample is chosen at random, so the person sampling cannot choose (even without meaning to) which individuals are measured. Sampling from several trees also stops one unusual tree deciding the result.

Mark scheme
  1. 1 mark

    choosing the largest acorns is biased: the samples do not represent the typical (mean) size of the acorns / she may judge 'largest' differently in each place

    ALLOW one tree in each place may not be typical of the trees there (for this mark if the bias in choosing is not given).

  2. 1 mark

    choose the acorns at random (for example by numbering them, or using random coordinates in a grid under the tree) from several trees in each place

    ALLOW pick up every acorn in a randomly placed quadrat. The idea of random selection is needed; IGNORE take more acorns (unqualified).

Question 3

3 marks

A student tested whether an antibacterial wipe reduces the number of bacteria on a laboratory bench.
• She rubbed a sterile cotton swab over a 10 cm × 10 cm area of the bench, then rubbed the swab across the agar in Petri dish 1.
• She cleaned the same area with the wipe, then rubbed a new sterile swab over it and across the agar in Petri dish 2.
• She rubbed a third sterile swab, which had not touched the bench, across the agar in Petri dish 3.

After incubation, there were 64 colonies in dish 1, 5 colonies in dish 2 and no colonies in dish 3.

Calculate the percentage decrease in the number of colonies after the bench was cleaned. Give your answer to 2 significant figures.

Explain why the student set up dish 3.

Model answer

Percentage decrease = (64 − 5) ÷ 64 × 100 = 92.2% = 92% (2 sf)
Dish 3 is a control. Because no colonies grew in it, the sterile swabs and the agar were not contaminated, so the colonies in dishes 1 and 2 must have come from bacteria on the bench.

Explanation

Percentage decrease = decrease ÷ starting value × 100, so divide by the number before cleaning (64). The control dish rules out other sources of bacteria, so the student can be confident that the difference between dishes 1 and 2 was caused by the wipe.

Mark scheme
  1. 1 mark

    (64 − 5) ÷ 64 × 100 / 59 ÷ 64 × 100; or a correct final answer of 92% with no working

    An answer of 92% with no working scores marking points 1 and 2. ALLOW 1 mark for 92.2% or 92.19% (not given to 2 significant figures). 7.8% (the percentage remaining) scores 0.

  2. 1 mark

    evaluation: 92 (%)

    ALLOW ECF for the significant-figure mark from a valid calculation.

  3. 1 mark

    it is a control: it shows that the swabs and the agar were not already contaminated, so the colonies in the other two dishes came from the bench

    Dish 3 is the control; dishes 1 and 2 are the bench samples. ALLOW to check that bacteria did not come from the swab, the agar or the air. IGNORE to make it a fair test (unqualified).

Question 4

4 marks

A plant breeder compared the yield of a new wheat variety, produced by selective breeding, with the yield of an old variety.

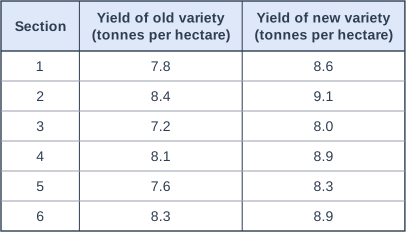
She divided a field into 12 equal sections and grew each variety in 6 sections. The sections of the two varieties alternated across the field, like the squares of a chessboard. The table shows the yield from each of the 6 sections of each variety.

Explain why the breeder spread the sections of each variety across the field.

Evaluate whether the results show that the new variety gives a higher yield than the old variety.

Table with columns "Section", "Yield of old variety (tonnes per hectare)", "Yield of new variety (tonnes per hectare)". Section: 1; Yield of old variety (tonnes per hectare): 7.8; Yield of new variety (tonnes per hectare): 8.6 | Section: 2; Yield of old variety (tonnes per hectare): 8.4; Yield of new variety (tonnes per hectare): 9.1 | Section: 3; Yield of old variety (tonnes per hectare): 7.2; Yield of new variety (tonnes per hectare): 8.0 | Section: 4; Yield of old variety (tonnes per hectare): 8.1; Yield of new variety (tonnes per hectare): 8.9 | Section: 5; Yield of old variety (tonnes per hectare): 7.6; Yield of new variety (tonnes per hectare): 8.3 | Section: 6; Yield of old variety (tonnes per hectare): 8.3; Yield of new variety (tonnes per hectare): 8.9.

Model answer

Soil, drainage and shade vary across a field. Spreading the sections of each variety across the field means both varieties grow in the same range of conditions, so a difference in yield is caused by the variety, not by where the sections were.
The mean yield of the new variety is 51.8 ÷ 6 = 8.6 tonnes per hectare, higher than the old variety's 47.4 ÷ 6 = 7.9 tonnes per hectare. However, the ranges overlap: the old variety ranged from 7.2 to 8.4 and the new from 8.0 to 9.1, so some sections of the old variety gave more than some sections of the new. The trial used only six sections of each in one field in one year, and yields depend on the weather. So the new variety probably gives a slightly higher yield, but it should be tested in more fields over several years before this is certain.

Explanation

Spreading or randomising sections is how field trials control variables that cannot be kept the same, such as soil. When judging a difference between means, look at the spread of the results too: overlapping ranges mean the difference is less certain, and a small trial in one year needs repeating to show it is reproducible.

Mark scheme
  1. 1 mark

    conditions such as soil, drainage, nutrients or shade vary across a field, so spreading the sections means both varieties experience the same range of conditions / differences in yield are caused by the variety, not by where the sections are

    5 marking points, max 4. Max 3 if the answer gives only one side (only evidence for or only evidence against a higher yield). ALLOW it controls the effect of variation in the field (on the results).

  2. 1 mark

    the mean yield of the new variety (8.6 tonnes per hectare) is higher than the mean yield of the old variety (7.9 tonnes per hectare)

    ALLOW means of 8.63 and 7.90. ALLOW the new variety's yield is higher in most sections, with a correct quotation of data.

  3. 1 mark

    but the ranges overlap (old 7.2 to 8.4, new 8.0 to 9.1) / some sections of the old variety (8.1, 8.3, 8.4) out-yielded some of the new variety (8.0, 8.3), so the difference may not be real / is uncertain

    The idea of overlap or spread must be supported by data.

  4. 1 mark

    only 6 sections of each variety, in one field, in one year, so the result may not be reproducible / repeat in other fields and years

    ALLOW yields depend on weather, so test over several years.

  5. 1 mark

    a conclusion that the new variety probably gives a slightly higher yield, but more evidence is needed before the result is certain

    The conclusion must be consistent with the evidence given.

Ready to try the rest? Every answer you write is marked against the mark scheme, so you can see exactly where the marks are.

Study Helper Hints first, answers after you try

Stuck on this one? Ask for a hint and I’ll point you in the right direction, without giving the answer away. Once you’ve checked your answer, I’ll show you how the marks are awarded.