Question 1
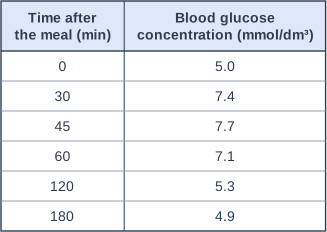
1 markA scientist measured the blood glucose concentration of a volunteer at different times after a meal.
The table shows the results.
Between which two times was the mean rate of decrease in blood glucose concentration greatest?
Choose your answer.
- A 30 and 45 minutes
- B 45 and 60 minutes
- C 60 and 120 minutes
- D 120 and 180 minutes
Model answer
B (45 and 60 minutes)
Mean rate of decrease = decrease ÷ time:
45 to 60 minutes: 0.6 ÷ 15 = 0.040 mmol/dm³ per minute
60 to 120 minutes: 1.8 ÷ 60 = 0.030 mmol/dm³ per minute
120 to 180 minutes: 0.4 ÷ 60 = 0.0067 mmol/dm³ per minute
Explanation
A rate is the change divided by the time taken, so intervals of different lengths cannot be compared just by the size of the change. The biggest fall (1.8 mmol/dm³) was between 60 and 120 minutes, but it was spread over 60 minutes, so its mean rate was lower than the 15-minute interval from 45 to 60 minutes. Choosing C is the common slip.
Mark scheme
-
1 mark
B / 45 and 60 minutes
The only correct answer is B: the concentration fell by 0.6 mmol/dm³ in 15 minutes, a mean rate of 0.040 mmol/dm³ per minute. A is not correct because the concentration rose between 30 and 45 minutes; C is not correct because although the fall was largest (1.8 mmol/dm³) it took 60 minutes, a mean rate of only 0.030 mmol/dm³ per minute; D is not correct because the fall of 0.4 mmol/dm³ in 60 minutes is a mean rate of about 0.0067 mmol/dm³ per minute. ALLOW the letter or the option. If more than one option is given, do not award the mark.