Hugh Christie Technology College
| School Type | Foundation School Secondary |
|---|---|
| Admissions | Modern |
| School Address | White Cottage Road |
| Tonbridge | |
| TN10 4PU | |
| Phone | |
| Local Authority | Kent |
| URL | |
| Age Range | 11 - 18 |
| Total Pupils | 820 |
| School Gender | Mixed |
| Boy | Girl % | 57.7% | 42.3% |
- Cage Green Primary(0.12 miles)
- Ridge View School(0.12 miles)
- Woodlands Infant School(0.7 miles)
- Woodlands Junior School(0.7 miles)
- Long Mead Community Primary(0.79 miles)
- Tonbridge School(1.07 miles)
- Slade Primary and Attached Un...(1.28 miles)
- St Stephen's (Tonbridge) Prim...(1.75 miles)
[View All Secondary Schools in Kent]
School Summary
Hugh Christie Technology College has 820 pupils, which places its total pupil count about average in the UK. With only 42.3% girls against 57.7% boys, the school has slightly more males than females. Educational welfare officers are appointed by the local authority to monitor attendance rates. With a 92.3% attendance rate, the attendance is below national average. With 47.2 members of staff, it is well staffed, with an ample number of teachers. With a very low 17:1 teacher/pupil ratio, the classrooms of Hugh Christie Technology College are very small, allowing the teachers to give attention to individual pupils` concerns.
Most employers consider 5 good CGSE grades at grade A-C as an important requirement in hiring decisions.
Post sixteen education entails voluntary progress onto A Levels, where a pupil may choose to specialise in a small range of academic subjects. The school achieved an average A Level score of 23.17, which is far below the nations average. A lower than average figure of £41764 is paid to the teachers of the school. The Hugh Christie Technology College has a 94.3% of pupils speaking English as a 1st language, which is above average for the schools location.
School Statistics
Gender Split
Gender Count By Age
| Total Pupils | 820 |
| Total Girls | 347 (42.3%) |
| Total Boys | 473 (57.7%) |
Attendance
| This School | Regional Avg | National Avg | ||
|---|---|---|---|---|
| Pupil Average Attendance |
92.3% | 94.7% | ||
| Persistent Absence |
25.8% | 13.5% | 12.8% | |
School Staff Information
| This School | Regional Avg | National Avg | ||
|---|---|---|---|---|
| Avg. Full-time Qualified Teacher Salary | £41,764 | £36,489 | £37,569 | |
| Pupil to Teacher Ratio |
17.4 : 1 | 15.6 : 1 | 15.1 : 1 | |
| Total Teachers in School | 49 | 66.4 | 67.5 | |
| Total Teaching Assistants |
18 | 16.2 | 19.4 | |
| Total Support Staff |
23 | 26.7 | 26.5 | |
| Total Full-time Teachers | 47.2 | 61.8 | 62.3 | |
| Total Full-time Teaching assistants | 13.6 | 12.6 | 15.1 | |
| Total Full-time Support Staff | 17.9 | 22.2 | 22.1 |
Information About Last Year Pupils Leaving
| This School | Regional Avg | National Avg | |
|---|---|---|---|
| Number of Pupils Leaving Last Year |
198 | ||
| 89% (176) | 94.4% | 93.8% | |
| 40% (79) | 30.2% | 39.1% | |
| 43% (85) | 61.5% | 45.5% | |
| 7% (13) | 5.2% | 6.4% | |
| 83% (164) | 89.2% | 89.5% |
Other Stats
| This School | Regional Avg | National Avg | ||
|---|---|---|---|---|
| Average Class Size |
23.3 | 20.1 | 20.3 | |
| Pupils where English is first Language |
94.3% (773) | 91.7% | 84.4% | |
| Pupils with Special Educational Needs |
2% (16) | 4.4% | 2.9% | |
| Pupils eligible for free school meals |
19.7% (247) | 9.8% | 13.4% | |
Performance
GCSE/Key Stage 4 Results (2016)
Summary
| This School | Regional Avg | National Avg | ||
|---|---|---|---|---|
| Total pupils at end of KS4 |
145 | |||
| Attainment 8 score |
41.6 | 49.4 | 49.7 | |
| Average GCSE Grade |
D | C | C | |
| Progress 8 measure |
-0.3 | - | - |
| Year | This School | Regional Avg | National Avg | ||
|---|---|---|---|---|---|
| Pupils achieving 5 or more A*-C |
2016 | 39% | 55.3% | 55.2% | |
| 2015 | 40% | 54.4% | 55.1% | ||
| 2014 | 43% | 55.2% | 55.4% | ||
| 2013 | 46% | 63.9% | 62.1% |
| This School | Regional Avg | National Avg | ||
|---|---|---|---|---|
| Pupils achieving more A*-C in English and Maths |
48% | 60% | 61% | |
| Average number of GCSEs per pupil | 5.9 | 8.2 | 8.4 | |
| Average number of GCSEs (incl. equivalents) per pupil |
8.1 | 9.2 | 9.2 |
Attainment Band
| This School | Regional Avg | National Avg | ||
|---|---|---|---|---|
| Pupils starting KS4 in low prior attainment band |
36% | 34.7% | 27.2% | |
| Pupils starting KS4 in middle prior attainment band |
11% | 57% | 53.8% | |
| Pupils starting KS4 in high prior attainment band |
53% | 65.3% | 39.4% |
A Level Results (2016)
Summary
| This School | Regional Avg | National Avg | ||
|---|---|---|---|---|
| Number of A Level student at the end of year | 154 | 194.1 | 189.2 | |
| Average point score per A level entry (as grade) | D+ | C | C | |
| Average point score per A Level entry | 23.17 | 30.7 | 31.8 | |
| Average grade in best 3 A level | C | C+ | C+ | |
| Average point score in best 3 A level entries | 29.6 | 36.4 | 36 | |
| Percentage of A levels pupils achieving AAB or better | 9.5% | 19.6% | 19.7% |
Ofsted
About Ofsted
Ofsted have been inspecting schools on a regular basis since 2005. After a cursory warning period they undertake a thorough examination of the whole school. Inspectors will sit in on classes, assessing each teacher's teaching ability. They will also evaluate the way the current curriculum is implemented, and how the progress of each student is tracked throughout their tenure.
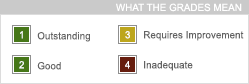
Each school is graded on a four point scale: 1 being outstanding, 2 being good, 3 means they require improvement, and 4 signifying inadequate. Those schools attaining an outstanding or good grade might not be re-inspected for as long as five years; while those receiving lower grades will be reassessed with greater frequency, with little or no notice prior to the inspectors arriving.
Ofsted Report for Hugh Christie Technology College on 05/12/2017
[View Full Report]| Inspection Date | 05/12/2017 |
| Inspection Type | S5 Inspection |
| Category of Concern | n/a |
Ofsted Report for Hugh Christie Technology College on 23/01/2014
[View Full Report]| Inspection Date | 23/01/2014 - 24/01/2014 |
| Inspection Type | S5 Inspection |
| Category of Concern | n/a |
Ofsted Report for Hugh Christie Technology College on 29/02/2012
[View Full Report]| Inspection Date | 29/02/2012 - 01/03/2012 |
| Inspection Type | S5 Inspection |
| Category of Concern | n/a |
Ofsted Report for Hugh Christie Technology College on 13/05/2009
[View Full Report]| Inspection Date | 13/05/2009 - 14/05/2009 |
| Inspection Type | Section 5 inspection |
| Category of Concern | n/a |
Financial Accounts
Admin Costs (per pupil)

Teachers Pay (cost per pupil)
Total Costs (per pupil)
| 2015-2016 | 2014-2015 | 2013-2014 | 2012-2013 | |||||
|---|---|---|---|---|---|---|---|---|
| Total | Per Pupil | Total | Per Pupil | Total | Per Pupil | Total | Per Pupil | |
| Grant Funding | £5,653,900 | £6,895 | ||||||
| School Generated Income | £218,120 | £266 | ||||||
| Total Income | £5,871,200 | £7,160 | ||||||
| All Teachers Pay | £2,941,340 | £3,587 | ||||||
| Support Staff + Insurance | £519,060 | £633 | ||||||
| Subtotal | £3,460,400 | £4,220 | £3,375,940 | £4,117 | £3,193,900 | £3,895 | £3,048,760 | £3,718 |
| Supply Teachers Pay | £75,440 | £92 | £75,440 | £92 | £55,760 | £68 | £82,000 | £100 |
| All Other Staff Pay | £73,800 | £90 | ||||||
| Building and Premises Cost | £273,060 | £333 | ||||||
| Administrative/Legal Costs | £363,260 | £443 | £355,880 | £434 | £339,480 | £414 | £320,620 | £391 |
| Catering/Food Costs | £45,100 | £55 | ||||||
| Energy Costs | £92,660 | £113 | £84,460 | £103 | £0 | £0 | £0 | £0 |
| Books/Equipment/School Trip Costs | £232,880 | £284 | ||||||
| Software/IT Costs | £38,540 | £47 | ||||||
| Bought in Professional Services | £36,080 | £44 | ||||||
| All Other Costs | £1084040 | £1322 | ||||||
| Total Costs | £5,775,260 | £7,043 | £5,720,320 | £6,976 | £5,189,780 | £6,329 | £4,974,120 | £6,066 |
Reviews

School Tutors Programme
Our Catch-up Tutor Programme can support your school with help from our tutors. We have provided tuition to over 100 schools. All our tuition is provided for online through our own interactive whiteboard.
School Tutors Programme - Find out more about our national programme here
How Does Our Tuition Programme Work?
Tutor Hunt has been operating for over 15 years, during this time have built up a vast number of tutors and teachers, and have the widest range of tutors and teachers available covering all major academic subjects nationally. The school tutors programme's aim is to help support and raise pupil attainment through our dedicated and experienced tutors. Only tutors who pass our strict eligibility requirements can join our School Tutors Programme.
Due to the pandemic it is likely that disadvantaged and vulnerable groups have been most affected. Our tutoring programme aims to support this group. Our programme does not need to be subsidised (but it can be supported by Pupil premium) and is priced around £60-£80 per pupil (per 15 lessons block).
- Our aim is to help support and raise pupil attainment through our dedicated and experienced tutors.
- Our tuition is tailored to your schools' needs through our online interactive whiteboard, our tutors can teach in groups or one-to-one.
- Over 100 schools are currently using our programme to support pupil teaching and learning.
- Our tutors undergo a full training and vetting process before being accepted on the School Tutors Programme.
Which year groups and subjects are covered?
Our programme covers Maths, English and the sciences from Year 1 to Year 11. If your school is seeking support with a different subject please contact us to see how we can help.
Which schools are covered on our programme?
The School Tutors Programme is open to all schools with no limitation on the amount of lessons booked.
School Tutors Near Hugh Christie Technology College
Hello, my name is Jenny and I live in Kent. I am a fully qualified primary school teache... [more]
I’ve been passionate about the French language from a very young age. When I was ab... [more]
I am a well qualified, experienced teacher and have been in teaching for over 20 years,... [more]
I am currently a full time lecturer and senior leader at a FE/SEN college and available... [more]