
Level:
Correct: 0
Incorrect: 0
Marks: 0/0
Exam Practice
Course:
Topics:
Avg
score:
–
Topics
done:
0/14

Participation trends and factors affecting participation

Practise 24 exam-style questions on Participation trends and factors affecting participation for OCR GCSE Physical Education (Paper 2). Write your answer as you would in the exam and get it marked in seconds against the mark scheme, point by point, with the Study Helper on hand if you get stuck.

  • 24 questions
  • 1–6 marks each
  • Instant marking
  • No sign-up needed
20 questions, marked as you go

Sample questions with model answers

Here are 4 of the questions in this topic, each with a model answer, an explanation of why it earns the marks and the mark scheme an examiner would use.

Question 1

1 mark

What is meant by disposable income?

Model answer

Disposable income is the money a person has left to spend after paying for essentials such as tax, rent, food and bills.

Explanation

Disposable income is what is left over once essentials are paid for, so it decides whether someone can afford membership fees, kit, equipment and travel for sport. Two people can earn the same wage but have very different disposable incomes if one has higher rent or more children to support. A common mistake is to say it is simply a person's wage.

Mark scheme
  1. 1 mark

    the money a person has left (to spend) after paying for essentials / bills / tax / household costs

    Accept: spare money after bills have been paid. Do not accept: 'money' or 'income' or 'wages' on their own.
Question 2

2 marks

State two ways that a young person's family could have a positive effect on their participation in sport.

Model answer

Parents can pay the club fees and buy the kit. They can also drive their child to training and matches and encourage them by watching.

Explanation

Family is one of the strongest influences on young people's participation: families provide money, transport, time and encouragement, and parents or older siblings who play a sport often act as role models. The opposite is also true: a family with little time or disposable income, or no interest in sport, can make participation harder. 'Support' on its own is too vague; say what kind of support.

Mark scheme
  1. 1 mark

    parents pay for membership / fees / kit / equipment

  2. 1 mark

    parents provide transport to training / matches

  3. 1 mark

    encouragement / emotional support / watching them play

  4. 1 mark

    parents or siblings act as role models / already play the sport / introduce them to it

  5. 1 mark

    the family takes part in activities together, e.g. family bike rides / swimming

  6. 1 mark

    family members volunteer / coach at the club

    Accept 'support' only if it is qualified (financial, emotional, transport). max 2

Question 3

2 marks

Using practical examples, explain two ways that environment or climate can affect participation in physical activity.

Model answer

Cold, wet weather in winter puts people off outdoor activities, so fewer people play tennis on outdoor courts or go cycling. The landscape also creates opportunities: people who live near the coast in Cornwall have the chance to surf or sail, which people living far from the sea do not.

Explanation

Environment/climate includes the weather, the seasons and the natural landscape. Bad weather reduces outdoor participation and can cancel fixtures, while coasts, lakes, hills and mountains create opportunities for particular activities. Each way needs a practical example to score.

Mark scheme
  1. 1 mark

    cold / wet / dark winter weather reduces participation in outdoor activities, e.g. fewer people cycle or play tennis outdoors in winter

  2. 1 mark

    warm, dry summer weather increases outdoor activity, e.g. more people swim outdoors / play cricket

  3. 1 mark

    snow / mountains give opportunities, e.g. skiing or climbing in the Scottish Highlands

  4. 1 mark

    living near the coast / lakes gives opportunities for water sports, e.g. surfing / sailing / kayaking

  5. 1 mark

    hilly or rural areas suit activities such as mountain biking / fell running / hiking

  6. 1 mark

    busy urban areas with traffic / pollution / little green space discourage outdoor running or cycling

  7. 1 mark

    extreme weather leads to cancelled fixtures, e.g. waterlogged or frozen pitches

    Each way needs a practical example; a point without a practical example scores 0. max 2

Question 4

4 marks

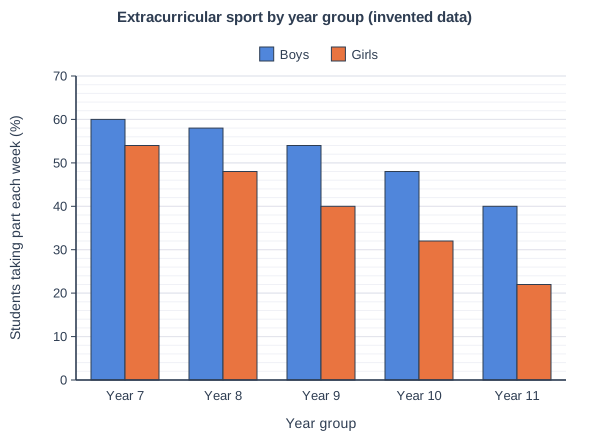
A secondary school recorded the percentage of boys and girls in each year group who took part in at least one extracurricular sports club each week. The data is invented.

The chart shows the results.

Describe two trends shown in the chart, and suggest a reason for each trend. Use data in your answer.

Extracurricular sport by year group (invented data). Dual bar chart of students taking part each week (%) for each year group, comparing Boys and Girls (a key above the chart shows which bar is which). Year 7: Boys 60, Girls 54; Year 8: Boys 58, Girls 48; Year 9: Boys 54, Girls 40; Year 10: Boys 48, Girls 32; Year 11: Boys 40, Girls 22.

Model answer

Trend 1: participation falls as students get older. Boys fall from 60% in Year 7 to 40% in Year 11, and girls from 54% to 22%. This may be because older students have more homework and exam revision, so they have less time for clubs.

Trend 2: boys take part more than girls in every year group, and the gap widens from 6 percentage points in Year 7 to 18 percentage points in Year 11. This may be because there are fewer female role models in the media, and some teenage girls feel self-conscious about their bodies or think sport is mainly for boys.

Explanation

To describe a trend, state the pattern across the groups and support it with figures from the chart; then give a reason using factors from the specification such as education, time commitments, gender, role models and media coverage. Here the fall with age and the widening gender gap are the two clearest trends. A common mistake is to quote single values without describing a pattern.

Mark scheme
  1. 1 mark

    First trend, supported by accurate data, e.g. participation falls as students get older, for both boys and girls (boys 60% in Year 7 to 40% in Year 11; girls 54% to 22%) / boys take part more than girls in every year group (Year 11: 40% compared with 22%) / the gap between boys and girls widens with age, from 6 percentage points in Year 7 to 18 in Year 11 / girls' participation falls by 32 percentage points compared with 20 for boys

    Trends: sub-max 2. A trend with no data, or with incorrect data, cannot score. Describing a single bar is not a trend.

  2. 1 mark

    A suitable reason for the first trend: for the fall with age, e.g. more homework / exam revision / coursework in Years 10 and 11 (time commitments) / part-time jobs / other interests or socialising / fewer clubs for older year groups; for the gender difference or widening gap, e.g. fewer female role models / less media coverage of women's sport / fewer clubs aimed at girls / self-consciousness about body image or changing / stereotyping that sport is for boys / peer pressure or friends not taking part

    Reasons: sub-max 2. Each reason must match the trend it explains.

  3. 1 mark

    Second, different trend, supported by accurate data (any from the first point)

    'Boys take part more than girls' and 'the gap widens with age' may be credited as two different trends, but the same reason given for both scores only once.

  4. 1 mark

    A suitable reason for the second trend (as in the second point)

    Accept any other accurate trend with a sensible matching reason. max 4

Ready to try the rest? Every answer you write is marked against the mark scheme, so you can see exactly where the marks are.

Study Helper Hints first, answers after you try

Stuck on this one? Ask for a hint and I’ll point you in the right direction, without giving the answer away. Once you’ve checked your answer, I’ll show you how the marks are awarded.