
Level:
Correct: 0
Incorrect: 0
Marks: 0/0
Exam Practice
Course:
Topics:
Avg
score:
–
Topics
done:
0/22

Genome, environment and variation; mutations

Practise 14 exam-style questions on Genome, environment and variation; mutations for OCR GCSE Combined Science (Biology Paper 2). Write your answer as you would in the exam and get it marked in seconds against the mark scheme, point by point, with the Study Helper on hand if you get stuck.

  • 14 questions
  • 1–6 marks each
  • Instant marking
  • No sign-up needed
14 questions, marked as you go

Sample questions with model answers

Here are 4 of the questions in this topic, each with a model answer, an explanation of why it earns the marks and the mark scheme an examiner would use.

Question 1

1 mark

Scientists studied one variant of a gene that affects the height of adult humans.

On average, adults with two copies of this variant are less than 1 cm taller than adults with no copies. Adults with this variant can still be short or tall.

Which statement describes the effect of this variant on height?

Choose your answer.

  • A It decides exactly how tall a person will be.
  • B It has no effect on height.
  • C It is not a mutation, because it is common.
  • D It is one of many factors that influence height.

Model answer

D - It is one of many factors that influence height.

Explanation

All variants arise from mutations. Most have no effect on the phenotype, some influence it and a very few determine it. A variant that shifts the average height by less than 1 cm, while people with it can still be short or tall, influences height but does not determine it.

Mark scheme
  1. 1 mark

    D / it is one of many factors that influence height

    The only correct answer is D: the variant changes the mean height a little, so it influences height, but people with it can still be short or tall because other genes and the environment also affect height. A is not correct because the variant does not determine height: people with it vary a lot in height; B is not correct because adults with two copies are taller on average, so it does have a small effect; C is not correct because all variants arise from mutations, even common ones. ALLOW the letter or the option. If more than one option is given, do not award the mark.
Question 2

2 marks

Identical twins develop from one fertilised egg, so they have the same genome.

The fingerprints of identical twins are very similar, but they are not exactly the same. Fingerprints form on a baby's fingers while it is growing in the uterus (womb), months before it is born.

Suggest why identical twins have slightly different fingerprints.

Model answer

Identical twins have the same genome, so the small differences in their fingerprints cannot be caused by different alleles. The differences must come from their environment in the uterus while the fingerprints were forming - for example, each twin was in a slightly different position and had different pressures on its fingers.

Explanation

The phenotype develops from the genome interacting with the environment. Identical twins share a genome, so their fingerprints are similar, but each twin develops in a slightly different environment in the uterus, so the fine detail differs. This is why fingerprints can tell identical twins apart.

Mark scheme
  1. 1 mark

    the differences cannot be caused by the genome / alleles, because identical twins have the same genome

    ALLOW the differences are not genetic / not inherited. ALLOW the similarity is caused by the (shared) genome, for this mark only if the answer also says the genome cannot explain the differences.

  2. 1 mark

    (so they are caused by) differences in the environment of each twin in the uterus (as the fingerprints form)

    ALLOW a suggested difference in the environment, for example different positions in the uterus / pressure on the fingers / touching the wall of the uterus / different amounts of space / different supply of food or oxygen (through the placenta or umbilical cord). DO NOT ALLOW a mutation as the only reason. IGNORE differences that happen after birth (for example cuts and scars), which are not how fingerprints first form.

Question 3

2 marks

Dachshunds and corgis are breeds of dog with short legs. In 2009 scientists found that the short legs of these breeds are caused by one variant in their DNA.

The body mass of a dog is affected by many variants of many genes, as well as by its food and exercise.

Scientists say that the short-leg variant determines the phenotype, but each of the body-mass variants only influences the phenotype.

Explain the difference between 'determines' and 'influences'. Use these examples.

Model answer

A variant that determines the phenotype decides it on its own: dogs with the short-leg variant have short legs. A variant that influences the phenotype only has a small effect: body mass also depends on many other genes and on the dog's food and exercise, so two dogs with the same body-mass variant can have very different masses.

Explanation

Very few variants determine the phenotype on their own; the short-leg variant in dachshunds and corgis is one of them. Most features, such as body mass, are influenced by many variants, each with a small effect, together with the environment. Most variants have no effect at all.

Mark scheme
  1. 1 mark

    determines: the short-leg variant on its own decides the phenotype / dogs with this variant have short legs (whatever their environment)

    ALLOW the variant controls / causes the phenotype on its own. The example (short legs) or the idea of the phenotype being decided by one variant is needed.

  2. 1 mark

    influences: each body-mass variant has only a small effect, because other genes and the environment (food / exercise) also affect body mass

    ALLOW dogs with the same body-mass variant can have different body masses. ALLOW the variant changes the body mass a little / makes it more likely to be higher or lower. DO NOT ALLOW the body-mass variants have no effect.

Question 4

4 marks

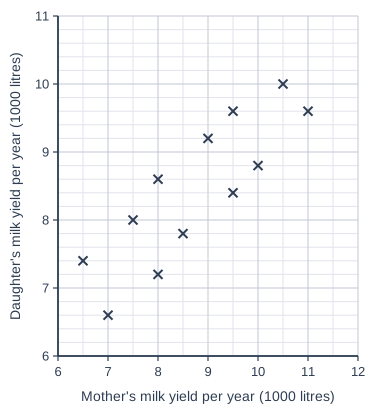
A dairy farmer recorded the milk yield of 12 cows, and of one daughter of each cow. Each yield was measured when the cow was 3 years old. All the cows lived on the same farm.

The scatter graph shows the results. Each cross shows one cow and her daughter.

Describe the pattern in the results.

Explain what the results suggest about the effects of the genome and the environment on milk yield. Use data from the graph.

Scatter graph on a grid of small squares. The horizontal axis is "Mother's milk yield per year (1000 litres)", from 6 to 12, numbered every 1, with 2 small squares between numbered values (each small square is 0.5). The vertical axis is "Daughter's milk yield per year (1000 litres)", from 6 to 11, numbered every 1, with 5 small squares between numbered values (each small square is 0.2). 12 points are plotted as crosses: (6.5, 7.4), (7, 6.6), (7.5, 8), (8, 7.2), (8, 8.6), (8.5, 7.8), (9, 9.2), (9.5, 8.4), (9.5, 9.6), (10, 8.8), (10.5, 10) and (11, 9.6).

Model answer

There is a positive correlation: cows with a higher milk yield tend to have daughters with a higher milk yield. For example, the daughters of the two cows that gave 10.5 and 11.0 thousand litres gave 10.0 and 9.6 thousand litres, but the daughters of the two cows that gave 6.5 and 7.0 thousand litres gave only 7.4 and 6.6 thousand litres. This suggests milk yield is partly controlled by the genome, because daughters inherit alleles from their mothers. But the points do not lie on a line: two cows that each gave 8.0 thousand litres had daughters giving 7.2 and 8.6 thousand litres. So other factors, such as the environment (food and health) and the alleles from the father, also affect milk yield.

Explanation

First describe the pattern (positive correlation), then explain it: inherited alleles make daughters resemble their mothers. The scatter shows that the genome does not decide yield on its own: the environment and the alleles from the father also matter. Because mothers and daughters lived on the same farm, part of the similarity could also come from their shared environment.

Mark scheme
  1. 1 mark

    (positive correlation) cows with a higher milk yield tend to have daughters with a higher milk yield

    1 mark for each of points 1 to 6, max 4. ALLOW positive correlation. ALLOW as the mother's yield increases, the daughter's yield increases. IGNORE proportional.

  2. 1 mark

    milk yield is (partly) controlled by the genome / daughters inherit alleles (genes) for milk yield from their mothers

    ALLOW milk yield is (partly) inherited / genetic.

  3. 1 mark

    the points do not lie on a straight line / daughters do not have exactly the same yield as their mothers, so other factors also affect yield

    ALLOW the correlation is not perfect / there is scatter.

  4. 1 mark

    the environment (for example the food / health / care of each cow) also affects milk yield

    ALLOW mothers and daughters share the same farm environment, so the correlation could be partly caused by the environment.

  5. 1 mark

    daughters also inherit (half of their) alleles from their father, so they do not have the same genome as their mother

    ALLOW the daughter's alleles are a mixture from both parents.

  6. 1 mark

    use of data from the graph, for example two cows with 8.0 thousand litres had daughters with 7.2 and 8.6 thousand litres / daughters of cows with 10.5 and 11.0 thousand litres gave 10.0 and 9.6 thousand litres, but daughters of cows with 6.5 and 7.0 thousand litres gave only 7.4 and 6.6 thousand litres

    Any correct pair of values read from the graph, used to support a point, gains this mark. ALLOW values within half a small square of those plotted.

Ready to try the rest? Every answer you write is marked against the mark scheme, so you can see exactly where the marks are.

Study Helper Hints first, answers after you try

Stuck on this one? Ask for a hint and I’ll point you in the right direction, without giving the answer away. Once you’ve checked your answer, I’ll show you how the marks are awarded.