
Question 1
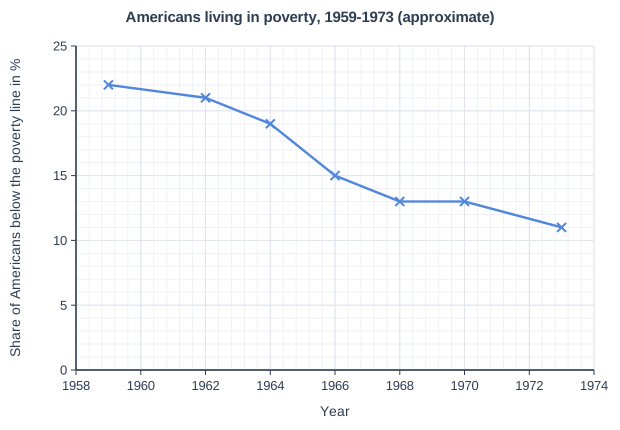
2 marksFigure 1 is a graph showing the approximate percentage of Americans living below the official poverty line, 1959-1973.
Using Figure 1, describe how the percentage of Americans living in poverty changed between 1964 and 1973, and give one reason for this change.
Model answer
The percentage of Americans living in poverty fell from about 19 percent in 1964 to about 11 percent in 1973, so it almost halved. One reason was Johnson's War on Poverty and Great Society, which gave poor people help such as food stamps, job training and free health care through Medicaid.
Explanation
The fall was fastest in the mid-1960s, when Great Society programmes began and the economy was growing strongly; historians debate how much was due to each. The number of poor Americans fell from about 36 million in 1964 to about 23 million in 1973.
Mark scheme
-
1 mark
It fell from about 19 percent in 1964 to about 11 percent in 1973 (it almost halved)
The answer must show a fall with approximately correct figures from the graph (accept 18-20 percent and 10-12 percent), or say that it nearly halved.
-
1 mark
A valid reason, e.g. Great Society programmes such as Medicare and Medicaid, food stamps, Job Corps or Head Start; increased Social Security benefits; strong economic growth and low unemployment in the 1960s
Accept any valid reason linked to the period, including economic growth.